
Learn Swing Trading Step by Step for Indian Stock Market (2026)
💡 What You'll Learn
- Easy Swing Trading is built around process, not prediction — making structured decisions using market context, stock behavior, and predefined rules instead of reacting to tips, news, or emotions.
- Market health comes before stock selection. The biggest mistake traders make is searching for opportunities without checking whether the overall market environment supports taking risk.
- Your watchlist provides valuable market feedback. Successful breakouts, failed breakouts, shakeouts, recoveries, and follow-through reveal whether opportunity quality is expanding or contracting.
- Strong stocks leave clues before major moves. Relative strength, constructive bases, tight price action, healthy volume, and institutional participation help identify potential market leaders.
- Opportunity discovery begins with conviction, not random screening. First understand the market and validate watchlist behavior; only then prepare to search for new high-quality candidates.
- Stress-free trading comes from preparation and disciplined execution — observe the market, follow a repeatable process, manage risk, document decisions, and improve one step at a time.
If you've ever felt that trading creates too much stress, confusion, and emotional pressure, the real problem may not be the market itself. It may be the absence of a clear process. Instead of reacting to every price move, you need a structured way to observe the market, evaluate opportunities, plan decisions, and respond with discipline. Stress-free trading begins when uncertainty is replaced by preparation.
Easy Swing Trading is built around one simple belief: context comes before setups. You first understand market health, then observe your watchlist, build conviction, discover opportunities, and only then move toward analysis and execution. The goal is not to predict every market move or trade every day. The goal is to follow a repeatable process that helps you stay selective, manage risk, and make better decisions over time.
📈 Understanding Easy Swing Trading in a Simple Way (And Why Process Matters More Than Prediction)
Easy Swing Trading is a structured approach where traders capture short-to-medium-term opportunities using market context, price behavior, and predefined rules. Instead of reacting to every market fluctuation, traders wait for favorable conditions, focus on quality stocks, prepare a clear plan, and manage every decision through a repeatable process.
Core Principles of Easy Swing Trading
- Not Prediction-Based Trading. Easy Swing Trading does not depend on predicting what the market will do next. Every decision begins with observing market context, stock behavior, and objective evidence.
- Not Setup-First Trading. A good-looking setup alone is never enough. Market health, watchlist feedback, relative strength, and institutional participation must support the opportunity.
- Not Constant Trading. Professional traders do not need to take trades every day. When market conditions are unfavorable or opportunity quality is contracting, staying patient is also a valid decision.
- Not Emotional Guesswork. Easy Swing Trading follows a structured process from market context and watchlist observation to opportunity discovery, analysis, execution, and management.
⚡Swing Trading vs Other Trading Styles — Which One Fits You Better?
The best trading style is the one you can follow consistently. Choose based on your time, experience, risk tolerance, and personal goals.
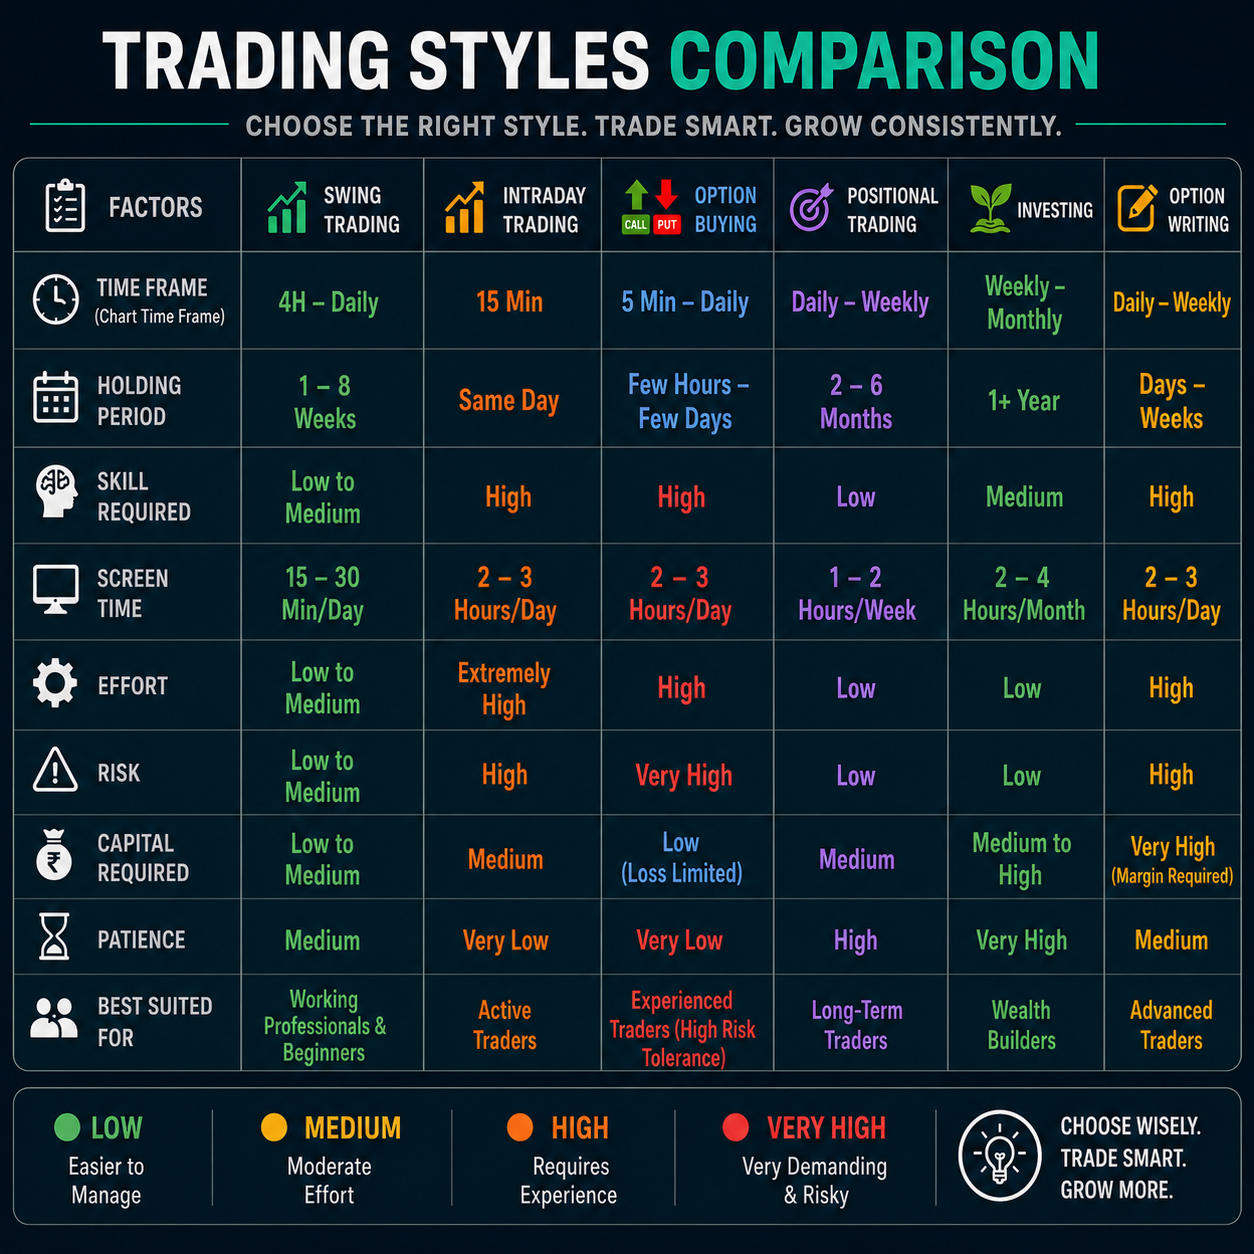
🌊 Markets Move in Cycles — Learn to Recognize the Phase
Markets do not move upward or downward forever. They move through repeating cycles created by changes in human behavior, institutional participation, liquidity, fear, and greed. Before increasing or reducing market exposure, understand which phase the broader market is currently moving through.
Accumulation — Smart Money Begins Building Positions
After a prolonged decline, selling pressure gradually reduces and stronger participants begin accumulating positions. Price may remain sideways, sentiment is often negative, and the opportunity is still not obvious to the majority of market participants.
Expansion — Participation and Opportunity Begin to Grow
Price begins trending higher, leadership expands, successful breakouts increase, and more stocks start participating. Watchlist feedback improves and opportunity quality expands. This is the phase where traders gradually become more active as evidence strengthens.
Distribution — Strength Begins to Lose Quality
The market may remain near highs, but internal behavior begins changing. Breakouts start failing, leadership narrows, volatility increases, and weaker stocks begin losing support. The objective is not to predict the top, but to recognize deterioration and become more selective.
Decline — Capital Preservation Becomes the Priority
Selling pressure dominates, market structure weakens, and opportunity quality contracts. Failed recoveries and breakdowns become more common. This is the phase to reduce exposure, protect capital, and wait patiently for conditions to improve.
The Weekly Market Cycle Review — Observe Before You Act
At the end of every week, review the broader market and ask: (1) Which market phase appears to be developing? (2) Is participation expanding or contracting? (3) Are breakouts succeeding or repeatedly failing? (4) Is leadership broadening or narrowing? Record your observations in your journal. The objective is not to predict the next market move, but to observe, adapt, and respond as conditions change.
🧠 The 5 Forces Behind Every Market Cycle
Market cycles are not random. They develop through changes in investor psychology, institutional behavior, liquidity, economic conditions, and market participation. Understanding these forces helps traders recognize why market conditions are improving or deteriorating without trying to predict the future.
Fear & Greed — The Emotional Engine of Markets
Market participants move through repeating emotional phases. Fear often dominates near periods of weakness, while optimism and greed increase as prices rise. These emotions influence buying, selling, and risk-taking behavior across every market cycle.
Human Behavior — Why Market Cycles Keep Repeating
Technology changes, companies change, and market conditions evolve—but human behavior remains remarkably consistent. Hope, fear, regret, overconfidence, and herd mentality repeatedly influence market decisions and help create recognizable market cycles.
Institutional Behavior — Follow the Movement of Large Capital
Institutions manage large amounts of capital and cannot build or reduce positions instantly. Their activity often develops gradually through accumulation, expansion, distribution, and decline. Price, volume, leadership, and participation can provide clues about these shifts.
Liquidity Cycles — Capital Moves Between Risk and Safety
When liquidity is supportive and risk appetite improves, capital tends to move toward equities and broader market participation can expand. When financial conditions tighten and risk appetite weakens, opportunity quality may contract and capital becomes more defensive.
Market Participation — Expansion Confirms the Cycle
A healthy market cycle is rarely supported by one index or a few large stocks alone. Observe whether leadership is broadening, more stocks are participating, and successful breakouts are increasing. Broad participation strengthens the evidence; narrowing participation demands caution.
🎯 The 5-Layer Easy Swing Trading Market Framework
A stock should never be analyzed in isolation. Before increasing exposure or searching for opportunities, professional traders study the environment in which those opportunities are developing. The Easy Swing Trading Market Framework observes five connected layers to understand whether conditions are becoming supportive, mixed, or defensive.
Global Market Sentiment & Liquidity
The idea: Indian markets operate within a connected global financial system. Global equity trends, emerging-market participation, bond yields, and currency behavior help us understand whether global capital is becoming more willing or less willing to take risk.
- Global Equity Trend: Observe whether global equity markets are strengthening, weakening, or moving sideways.
- Emerging Markets: Check whether emerging markets are attracting capital and showing improving participation.
- Global Liquidity: Observe bond-market conditions and whether financial pressure is increasing or easing.
- Currency Pressure: Monitor whether currency behavior is supportive or creating pressure on domestic risk assets.
- Core Question: Is the global environment becoming supportive for risk-taking, or is global capital becoming defensive?
Domestic Liquidity, Currency & Volatility
The idea: Even when global conditions appear supportive, domestic conditions must also be evaluated. Interest-rate expectations, currency pressure, and volatility help us understand whether the Indian market environment is stable enough for taking risk.
- Domestic Liquidity: Observe India’s bond-yield behavior and changing interest-rate expectations.
- Currency Impact: Monitor USDINR for signs of currency stability or increasing pressure.
- Market Volatility: Use India VIX to understand whether uncertainty and emotional pressure are expanding or contracting.
- Environment Check: Stable conditions generally support participation, while rising pressure demands greater selectivity.
- Core Question: Are domestic financial conditions supportive, stable, or becoming increasingly stressful?
Inflation, Safety Demand & Economic Activity
The idea: Commodities provide useful clues about changing macroeconomic conditions. Crude oil can influence inflation pressure, Gold reflects safe-haven demand, and Silver can provide clues about industrial activity and economic expectations.
- Brent Crude: Observe whether energy prices are increasing or reducing inflation pressure.
- Gold: Rising safe-haven demand may indicate increasing uncertainty or defensive positioning.
- Silver: Strength can provide clues about improving industrial demand and economic activity.
- Combined Reading: Never judge the macro environment using one commodity in isolation.
- Core Question: Are macro conditions supporting growth and risk-taking, or is defensive behavior increasing?
Breadth, Benchmark Trend & Institutional Leadership
The idea: An index can rise even when participation underneath the surface is weak. Broad market analysis helps determine whether strength is spreading across the market or being driven by only a narrow group of large stocks.
- Broad Market Health: Observe whether a wider universe of stocks is participating in the market trend.
- Benchmark Trend: Evaluate the direction and quality of large-cap market leadership.
- Institutional Leaders: Check whether major institutionally owned companies are participating.
- Breadth Confirmation: Stronger markets generally show participation across multiple groups, not isolated index strength.Exit: When 20 EMA crosses back below 50 EMA, or price closes below 50 EMA on daily.
- Core Question: Is the market genuinely healthy, or is headline index strength hiding weak internal participation?
Banks, Midcaps & Smallcaps
The idea: Risk appetite becomes clearer when participation expands beyond a few defensive or large-cap stocks. Banks, Midcaps, and Smallcaps help reveal whether investors are willing to participate across different areas of the market.
- Banking Strength: Observe whether financial leadership is supporting the broader market environment.
- Midcap Participation: Strength can indicate expanding opportunity and increasing willingness to take risk.
- Smallcap Participation: Healthy participation may reflect broader confidence, while persistent weakness can signal caution.
- Combined Confirmation: Participation across Banks, Midcaps, and Smallcaps strengthens evidence of expanding risk appetite.
- Why It Matters: We are not predicting the market—we are observing whether participation and opportunity are expanding or contracting.
🛡️ Watchlist Management & Daily Market Feedback
A watchlist is not just a collection of stocks waiting for entry. It is a live feedback system that shows how quality stocks are behaving in the current market. By observing breakouts, shakeouts, recoveries, failures, and follow-through, traders can understand whether opportunity quality is improving or deteriorating.
The Watchlist Feedback Principle
Never judge market opportunity from one stock alone. Observe the behavior of your watchlist as a group. When more stocks break out successfully, recover quickly, and show strong follow-through, opportunity may be expanding. When failures increase and recoveries weaken, become more selective.
🔍 How to Review Your Watchlist — Step by Step
Observe Stock Behavior
Review how each stock behaved after entering your watchlist. Did it break out successfully, experience a shakeout and recover, remain sideways, or begin showing weakness? Your first job is to observe behavior without forcing a conclusion.
Classify the Feedback
Group stocks based on what the market is showing: Successful Breakout, Failed Breakout, Shakeout Recovery, Sideways Behavior, or Weakness. Look for patterns across the entire watchlist instead of reacting emotionally to one stock.
Remove, Hold, or Upgrade
Remove stocks showing repeated weakness, failed recoveries, poor relative performance, or broken structure. Hold stocks that remain constructive but need more time. Upgrade strong leaders showing healthy behavior and improving follow-through for closer attention.
📅 The Daily & Weekly Watchlist Management Routine
A strong watchlist does not stay strong automatically. Stocks change, market conditions change, and leadership changes. A simple review routine helps you observe stock behavior, remove weak candidates, and keep your attention focused on the strongest opportunities.
- 📋 Daily Review: Observe all watchlist stocks after market hours. Check successful breakouts, failed breakouts, shakeouts, recoveries, sideways stocks, and unusual weakness.
- 📊 Behavior Check: Ask what each stock is doing now. Is it showing follow-through, holding structure, recovering quickly, or beginning to lose strength?
- 📉Priority Update: Move the strongest stocks higher on your priority list. Keep constructive stocks under observation and reduce attention on stocks showing weak behavior.
- 🧘Weekly Review: Review the complete watchlist together. Compare relative performance, trend quality, institutional participation, and overall stock behavior.
- 🖊 Clean the List: Remove stocks showing repeated weakness, failed recoveries, broken structure, or poor relative performance. A smaller quality list is better than a large weak list.
- 📱 Monday: Adds a stock after seeing a tip, post, video, or sudden price move. No clear reason is written for adding it to the existing watchlist.
- 📉 Tuesday: Stock shows weakness. Keeps watching because it may recover, without checking structure or relative performance against other stronger stocks.
- 😰 Wednesday: Another stock fails after breakout. Instead of observing the feedback, ignores the failure and searches for more stocks to add to the watchlist.
- 📺 Thursday: Watchlist keeps growing. Weak stocks stay, priorities are unclear, and attention is divided across too many names without any clear review process.
- 😤 Friday: Has a long watchlist but no clear understanding of which stocks are strong, weak, improving, or ready to be removed from the active tracking list.
- 🤷 Next Week: Repeats the same process with more stocks, more noise, and less clarity about the actual market environment
🎯 The 6 Steps Before Opportunity Discovery
🧭 Understanding Stage Analysis Before Studying a Setup
- ✅ Stage Analysis: Identify whether the stock is in Stage 1, Stage 2, Stage 3, or Stage 4 before studying any setup or opportunity.
- ✅ Stage 1 — Basing: Price moves sideways after a decline. Selling pressure reduces, volatility may contract, and a new base begins to develop.
- ✅ Stage 2 — Advancing: Price moves into a healthy uptrend with improving structure, relative strength, participation, and institutional interest.
- ✅ Stage 3 — Topping: The previous uptrend begins losing quality. Price becomes unstable, volatility may increase, and distribution can start appearing.
- ✅ Stage 4 — Declining: Price enters a clear downtrend. Lower highs, lower lows, weak recoveries, and selling pressure become more visible.
- ❌ Setup Without Stage Context: The same chart pattern can behave differently in different stages. Never judge a setup without understanding the stock's larger structure.
- ❌ Predicting Stage Changes: Stage Analysis is about reading present evidence. Do not assume a stock has entered Stage 2 before the structure confirms it.
📈 The Easy Swing Trading Stage Analysis Checklist
- 01Check the Big Picture: Start with the larger chart structure. Is the stock basing, advancing, topping, or declining? Understand the current stage before studying smaller price movements.
- 02Identify the Current Stage: Classify the stock into Stage 1, Stage 2, Stage 3, or Stage 4 using the available price and volume evidence. Avoid forcing unclear charts into a stage.
- 03Study Trend Quality: Check whether price structure is improving or weakening. Observe higher highs, higher lows, lower highs, lower lows, and the overall quality of the trend.
- 04Check Relative Strength: Compare the stock with the broader market and other stocks. Strong Stage 2 candidates should show leadership or improving relative performance.
- 05Observe Price and Volume: Study whether volume supports the price move. Look for healthy participation during strength and signs of selling pressure during weakness.
- 06Look for Institutional Clues: Observe tightness, controlled pullbacks, constructive consolidations, volume behavior, and strong recovery after temporary weakness.
- 07Avoid Weak Stage Conditions: Be careful with stocks showing poor structure, repeated failed recoveries, heavy selling, weak relative strength, or clear Stage 4 behavior.
- 08Move Only Quality Stocks Forward: Stage Analysis is a filtering process. Only stocks showing the right stage, healthy structure, and supporting evidence should move to the next step.
❓ Frequently Asked Questions
How much money do I need to start swing trading in India?
You can start learning with any capital, but ₹50,000 is a practical starting point for applying proper risk management. With ₹50,000 capital and 0.5% risk per trade, your maximum planned risk is ₹250. The goal is not to make big money quickly—it is to learn position sizing, protect capital, and execute the process consistently.
Can I do swing trading with a full-time job?
Yes—swing and positional trading can fit around a full-time job. You can analyse the market, prepare your watchlist, and plan trades outside market hours, then review positions briefly each day. The focus is not constant screen watching; it is preparation, predefined risk, disciplined execution, and journaling.
How is swing trading taxed in India (2026)?
Tax treatment depends on how your trading activity is classified and your individual circumstances. Maintain proper records of trades, profits, losses, and charges. Since tax rules can change, consult a qualified CA for advice specific to your situation.
What's the best chart timeframe for swing trading?
The daily chart is the primary timeframe for swing trading decisions, while the weekly chart provides broader market and stock context. Avoid jumping between lower timeframes just to find confirmation for a trade.
Should I use stop-loss orders or mental stops?
Use a predefined stop-loss and exit plan. Mental stops often become emotional when price moves against you. Decide the invalidation level and maximum risk before entry, then execute according to the plan.
Swing trading vs options — which is better for beginners?
Start with equity swing trading. Beginners should first learn Market Health, stock selection, entry, risk management, trade management, and journaling. Build a rule-based foundation before exploring more complex instruments.
How many trades should I take per week?
Quality over quantity—always. There is no fixed number of trades you must take. Some weeks may offer multiple valid opportunities, while others may offer none. Your job is to follow the process, not manufacture trades. Patience is part of the system.
What are the best books for learning swing trading?
Study books that teach market cycles, price and volume behaviour, risk management, and trading psychology. But remember: collecting information is not the goal. Choose one structured process, execute it consistently, journal every trade, and learn from your own data.
📈 Swing Trade With Structure, Not Impulse
Easyswingtrade.com gives you daily chart scanners, GTT stop-loss automation, sector rotation dashboards, and a built-in trade journal — so your swing trading rules run on code, not emotion.