
Technical Analysis — The Complete Guide to Charts, Trends & Market Behaviour
⭐ Why This Technical Analysis Guide is Different
- Built specifically for Indian stock market traders with practical examples instead of confusing theory.
- Learn how to understand price action before using indicators, so every tool makes more sense.
- Simple explanations of market structure, trends, demand & supply, and market psychology for beginners.
- Real chart examples that explain technical analysis concepts step by step using Indian stocks.
- Designed for the Indian stock market with concepts that work across stocks, indices, and different market conditions.
- Build a strong technical analysis foundation before moving to advanced trading strategies, setups, and stock selection.
Let's be honest — thousands of articles explain technical analysis, but very few teach you how to actually understand a price chart. Most beginners jump directly to indicators and trading strategies without first building a strong foundation. That's exactly why many traders struggle to apply technical analysis consistently in real market conditions. This guide is designed to bridge that gap by helping you understand the concepts before using them.
This isn't another collection of candlestick names or indicator settings. Instead, you'll learn the core principles behind technical analysis—from market trends and price action to support & resistance, chart patterns, volume analysis, and risk management. Every topic is explained in a simple, practical way with examples from the Indian stock market, so you can build a solid foundation before moving on to advanced trading strategies.
📈 What is Technical Analysis? (And What It Is NOT)
Technical Analysis is the study of price, volume, and market behaviour to understand how a stock is likely to move. Instead of predicting the future, technical analysis helps traders make informed decisions by analysing historical price data, chart patterns, trends, and market psychology.
📈 Why Technical Analysis Works
Technical Analysis has remained relevant for decades because it is based on how markets actually behave. Prices move due to buying and selling decisions, and those decisions are influenced by human emotions, demand & supply, and market participation. Understanding these core principles helps traders analyse the market with greater clarity instead of relying on guesswork.
⚡ Market Cycles
Every stock moves through a repeating cycle of accumulation, uptrend, distribution, and decline. Learning to identify the current market stage helps traders understand where opportunities are strongest and where risk begins to increase.
🔄 The Four Stages of a Market Cycle
While every market is different, most trends follow four broad stages. Understanding these stages helps traders align their decisions with the market instead of fighting it.
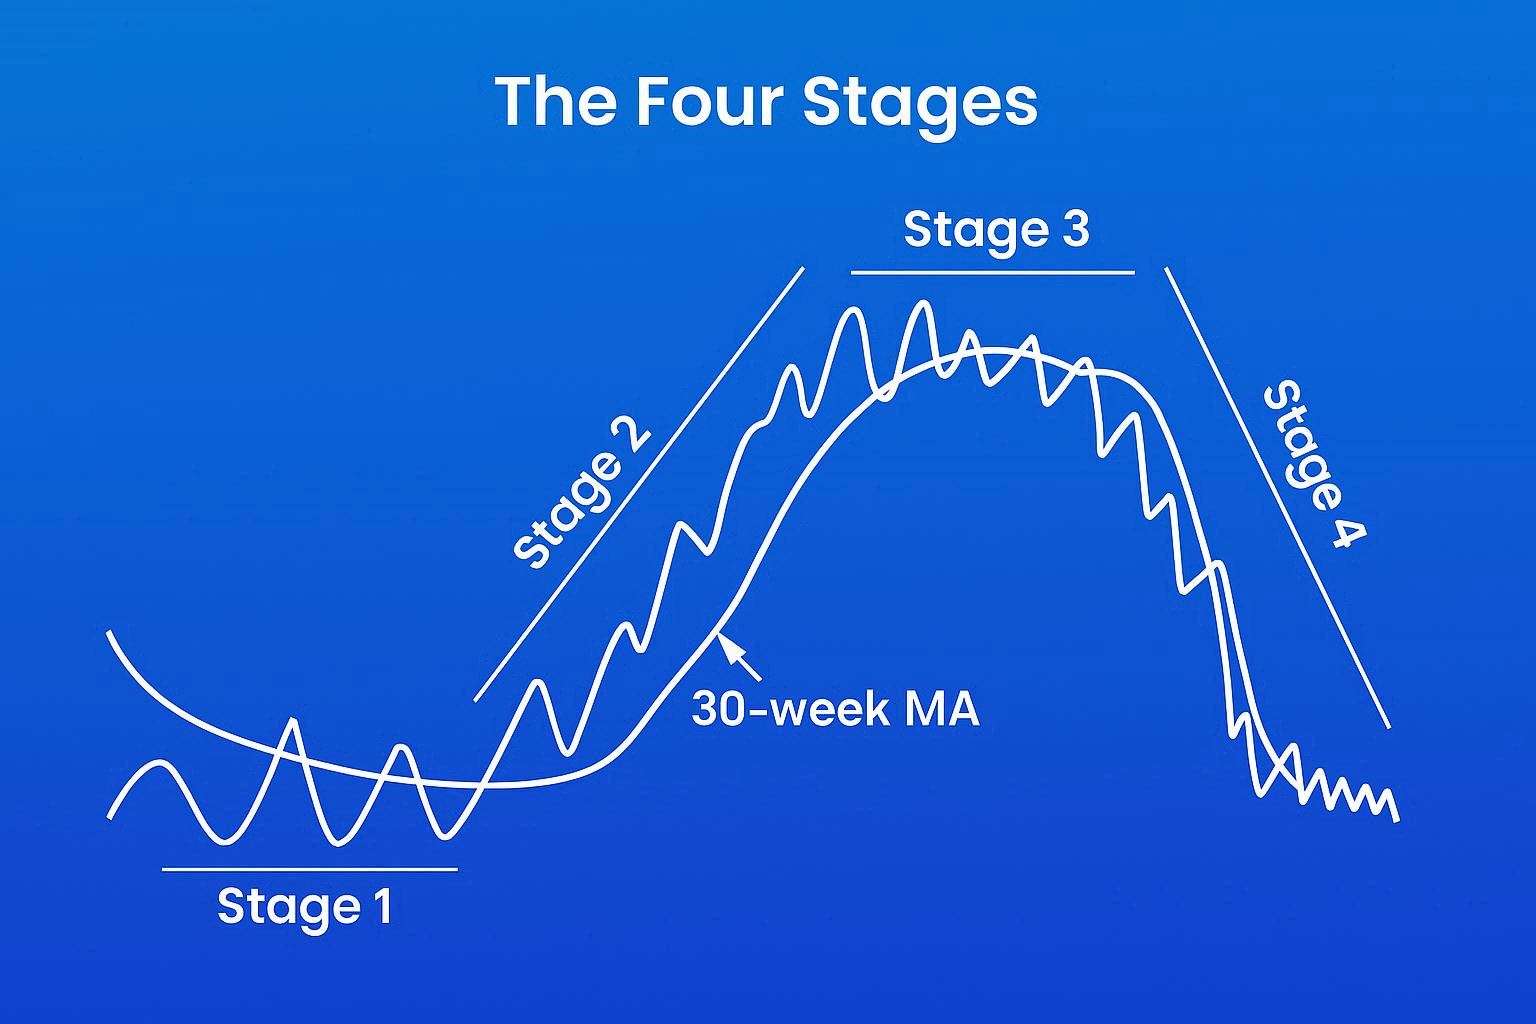
📊 Understanding Stage Analysis
This is the step most traders ignore—and it changes every mathematical assumption that follows. Before calculating win rate, risk–reward, or position size, you must first ask: Is the current market environment supporting my trading strategy, weakening it, or offering limited opportunity?
After a decline, the stock stops falling and begins moving sideways. Buyers and sellers are almost balanced, and the market starts building a base before the next major move.
Demand becomes stronger than supply, causing the price to make higher highs and higher lows. This is where healthy trends develop and traders often look for buying opportunities.
After a strong rally, buying momentum starts slowing down. The stock may move sideways again as early buyers begin booking profits and volatility gradually increases.
Selling pressure becomes stronger than buying pressure, leading to lower highs and lower lows. The trend weakens until a new base begins to form.
Markets do not remain in one stage forever. Understanding the current stage helps traders decide whether they should look for buying opportunities, stay patient, or avoid weak market conditions.
🔢Types of Market Participants
Every price movement in the stock market is created by participants with different objectives, capital, and investment horizons. While everyone buys and sells in the same market, not everyone behaves the same way. Understanding who is active helps traders interpret why trends begin, strengthen, and eventually reverse.
👨💻The Four Types of Market Participants
Every major market trend typically progresses through different groups of participants. As confidence grows, one group gradually hands over control to the next. Recognizing which participants are currently driving the market provides valuable context for understanding price behaviour.
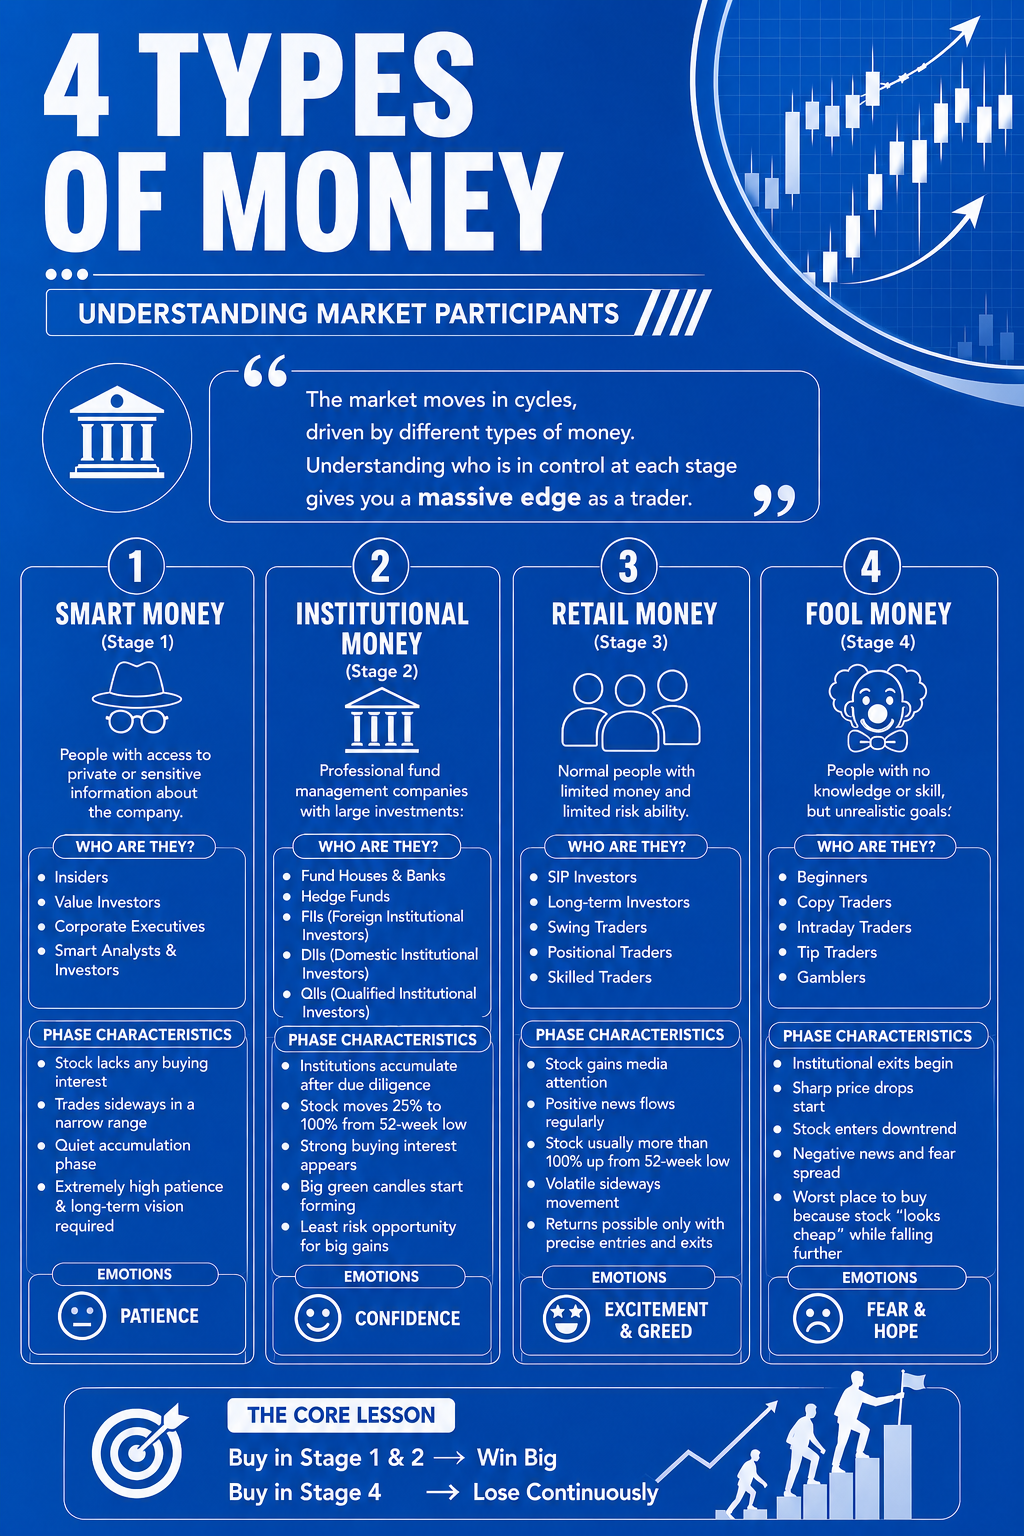
- 🟢 Smart Money (Early Accumulation) - Smart Money represents company insiders, experienced investors, and early institutional participants who accumulate positions before the broader market notices the opportunity. During this phase, prices usually move sideways while informed participants quietly build positions.
- 🔵 Institutional Money (Trend Expansion) - Once the trend begins, large institutions such as mutual funds, insurance companies, pension funds, FIIs, and DIIs start deploying significant capital. Their buying creates sustained momentum and is often responsible for long-lasting market trends.
- 🟠 Retail Money (Public Participation) - As prices continue rising, media coverage and public interest increase. Retail investors, swing traders, positional traders, and SIP investors begin participating in larger numbers, helping extend the existing trend.
- 🔴 Emotional Money (Late Participation) - Near the later stages of a trend, many participants enter due to fear of missing out rather than a structured process. Decisions become emotional instead of rule-based, often resulting in buying near market tops or selling after panic declines.
Every market participant has different objectives, capital, and trading behaviour. Understanding who is active in the market helps traders interpret price movements with greater confidence.
🎯Market Basics
Before learning chart patterns, indicators, or trading strategies, every trader should understand how the stock market actually works. The market is not controlled by predictions—it is a continuous auction where buyers and sellers interact. Every price movement begins with a transaction between two participants, making these basic concepts the foundation of technical analysis.
🏛️ What is the Stock Market?
The stock market is a marketplace where investors and traders buy and sell shares of publicly listed companies. When you purchase a share, you become a partial owner of that company. Prices change throughout the trading session as buyers and sellers agree on different prices.
⚖️ How the Stock Market Works
Every trade requires one buyer and one seller. Buyers try to purchase shares at lower prices, while sellers aim to sell at higher prices. The market continuously matches these orders, creating a fair price through the interaction of demand and supply.
✨ Simply put:
📈 More buyers than sellers → Prices generally rise. 🚀📊
📉 More sellers than buyers → Prices generally fall. 🔻😟
⚖️ Equal buying and selling pressure → Prices often move sideways. ↔️📦
💹 Price Discovery
Stock prices are not fixed. They change continuously as market participants place buy and sell orders. This process is known as price discovery, where the market determines the current value of a stock based on available information and participant behaviour.
💰 Bid Price, Ask Price & Spread
💰 Every stock has two important prices:
📊 Volume & Liquidity
Volume represents the number of shares traded during a specific period. Higher volume generally indicates stronger market participation.
⏰ Trading Session
The Indian stock market operates during fixed trading hours.
📝 Common Order Types
Every trade is executed using an order.
📈 Market Index
A market index measures the overall performance of a group of stocks.
The stock market functions through the continuous interaction of buyers and sellers. Understanding price discovery, bid and ask prices, volume, liquidity, order types, and market indices builds a strong foundation before moving on to trends, chart patterns, support & resistance, and other technical analysis concepts.
📈 Dow Theory
Dow Theory is one of the oldest and most influential principles of technical analysis. Developed by Charles Dow, it explains how markets move, why trends develop, and how traders can identify the overall direction of the market. Most modern technical analysis concepts—including trends, support & resistance, and chart patterns—are built upon these foundational ideas.
🏛️ What is Dow Theory?
Dow Theory states that markets move in identifiable trends rather than random price movements. Instead of predicting the future, traders should observe price behaviour and follow the existing trend until clear evidence suggests it has changed.
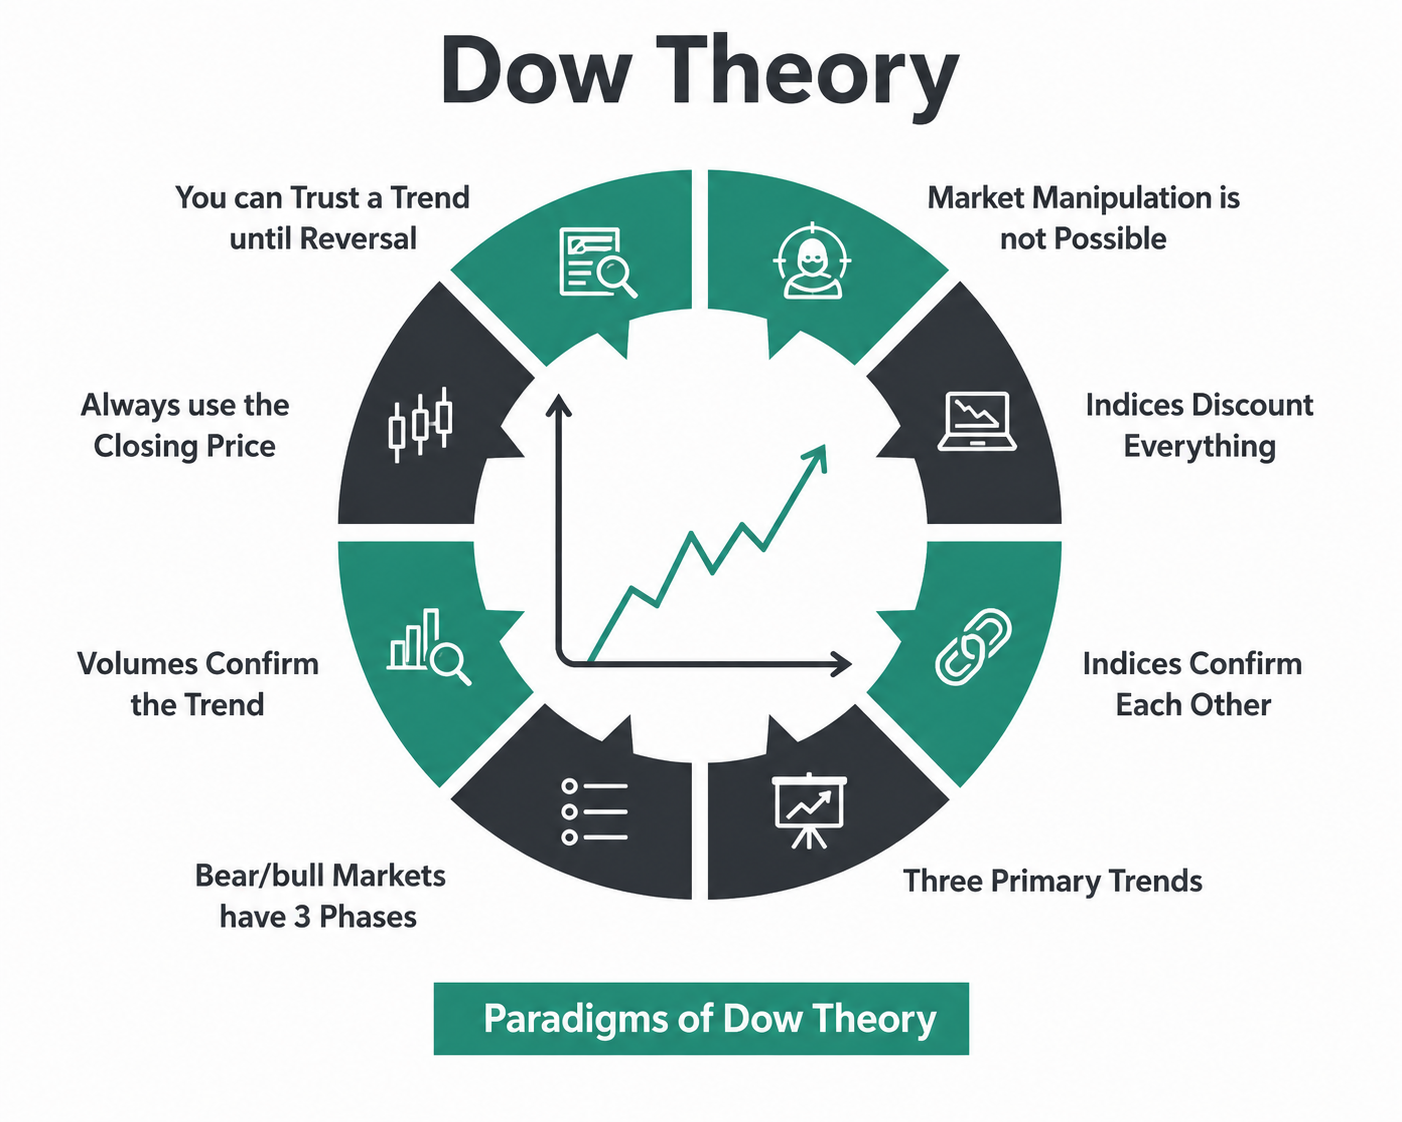
📊 The Six Principles of Dow Theory
Dow Theory is based on six core principles that explain how markets behave over time.
Every known piece of information—including news, earnings, economic events, and investor expectations—is reflected in the current market price. Rather than reacting to headlines, technical analysts focus on price because it represents the combined decisions of all market participants.
Prices do not move randomly. Markets generally move in one of three directions: an Uptrend, where prices form higher highs and higher lows; a Downtrend, where prices create lower highs and lower lows; or a Sideways Trend, where prices fluctuate within a range without a clear direction. Identifying the current market trend is one of the most important decisions a trader can make before taking any trade.
Every major market trend typically develops through three phases: Accumulation, where smart money quietly builds positions before the trend becomes visible; Public Participation, where the trend gains momentum and attracts broader market participation; and Distribution, where early buyers gradually exit while late participants continue buying. Understanding these phases helps traders identify where the market is currently positioned and make more informed trading decisions.
Charles Dow believed that major market indices should move in the same general direction to confirm the strength of a trend. For example, if the Nifty 50 is making new highs while broader market participation remains weak, traders should become more cautious because the move lacks broad confirmation. Strong and sustainable trends usually show participation and confirmation across multiple parts of the market, increasing the reliability of the trend.
Healthy market trends are generally supported by increasing participation. When prices rise with strong trading volume, it often indicates healthy buying interest and strengthens the bullish trend. Conversely, falling prices accompanied by expanding volume usually signal stronger selling pressure and reinforce the bearish trend. While price tells traders what the market is doing, volume helps explain how strongly market participants support that move, making it an essential tool for trend confirmation.
A single correction does not necessarily mean that a trend has ended. Instead of assuming every pullback is a trend reversal, disciplined traders wait for objective confirmation before concluding that the market direction has changed. In most cases, following the existing trend leads to better trading decisions than trying to predict every turning point, helping traders stay aligned with the market rather than reacting emotionally.
📈 Market Trends
One of the most important skills in technical analysis is identifying the direction of the market. Markets rarely move randomly—they tend to follow trends created by the continuous interaction between buyers and sellers. Understanding the current trend helps traders align with market momentum instead of trading against it.
📊 What is a Market Trend?
A market trend is the overall direction in which the price of a stock or a market index moves over a period of time. Rather than focusing on every small price fluctuation, traders analyze the bigger picture to understand whether buyers or sellers are in control of the market. Identifying the prevailing trend helps traders make better trading decisions by aligning their trades with the market's direction. A fundamental principle of technical analysis is that a trend remains in place until there is clear evidence that it has reversed or changed, making trend analysis one of the most important concepts in successful trading.
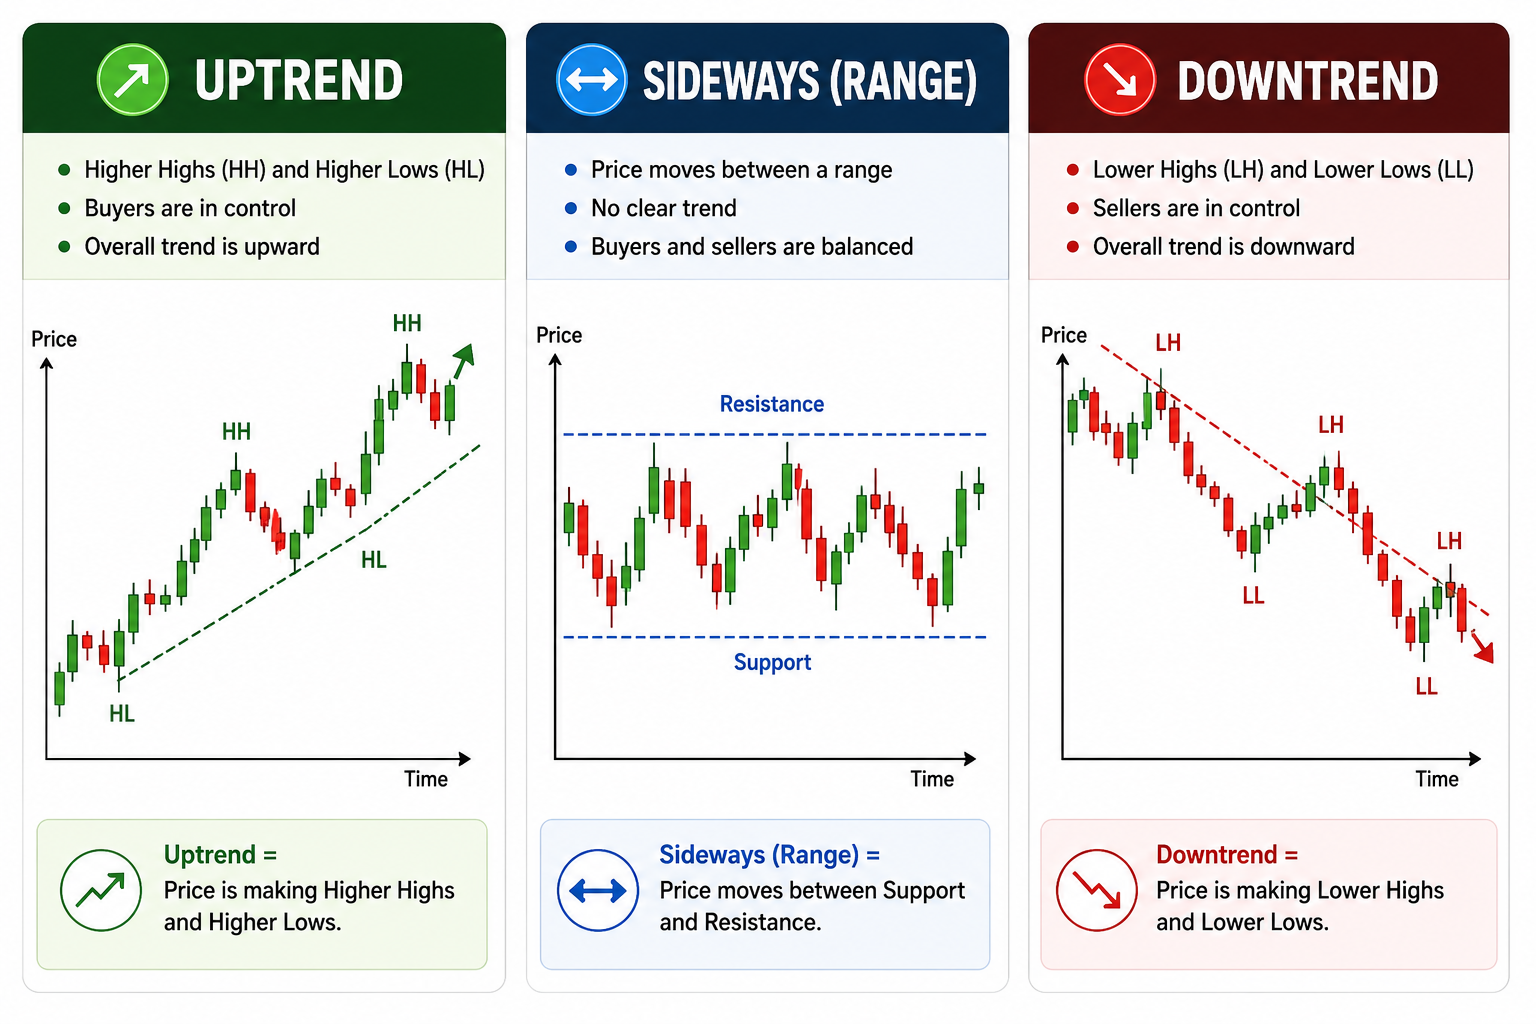
📈 The Three Types of Market Trends
Every market generally moves in one of three directions.
An uptrend is a market condition where demand consistently exceeds supply, causing prices to make Higher Highs (HH) and Higher Lows (HL).
A downtrend is a market condition where supply exceeds demand, causing prices to form Lower Highs (LH) and Lower Lows (LL).
A sideways trend is a market condition where buyers and sellers are evenly matched, causing prices to move within a defined support and resistance range.
How to Identify a Trend
Instead of guessing, traders use simple price structure.
Many beginners struggle because they trade against the dominant trend.
Common mistakes include:
- ➜Buying during a strong downtrend.
- ➜Selling during a healthy uptrend.
- ➜Confusing a pullback with a trend reversal.
- ➜Entering trades before the trend is confirmed.
Patience often produces better results than trying to predict every turning point.
Trading with the trend gives you a higher probability of success.
Why market trends matter:
- ➜ Improves the probability of successful trades.
- ➜ Helps identify high-quality trading opportunities.
- ➜ Makes technical analysis tools more reliable.
- ➜ Supports better risk management and decision-making.
Trading with the trend often produces better results than trying to predict every market reversal.
A market trend reflects the ongoing battle between buyers and sellers. By identifying whether the market is in an uptrend, downtrend, or sideways phase, traders can make decisions that align with price behaviour instead of relying on predictions. Successful trading often begins with one simple question: "Who is currently in control—buyers or sellers?"
🕯️ Candlestick Charts
Candlestick charts are one of the most widely used charting methods in technical analysis. Each candlestick represents the price movement of a stock during a specific time period, helping traders quickly understand whether buyers or sellers were in control.
📈 What is a Candlestick?
A candlestick is a graphical representation of price movement during a specific timeframe.
🕯️ Parts of a Candlestick
📊 Every candlestick consists of two main parts:
🟢 Bullish Candlestick
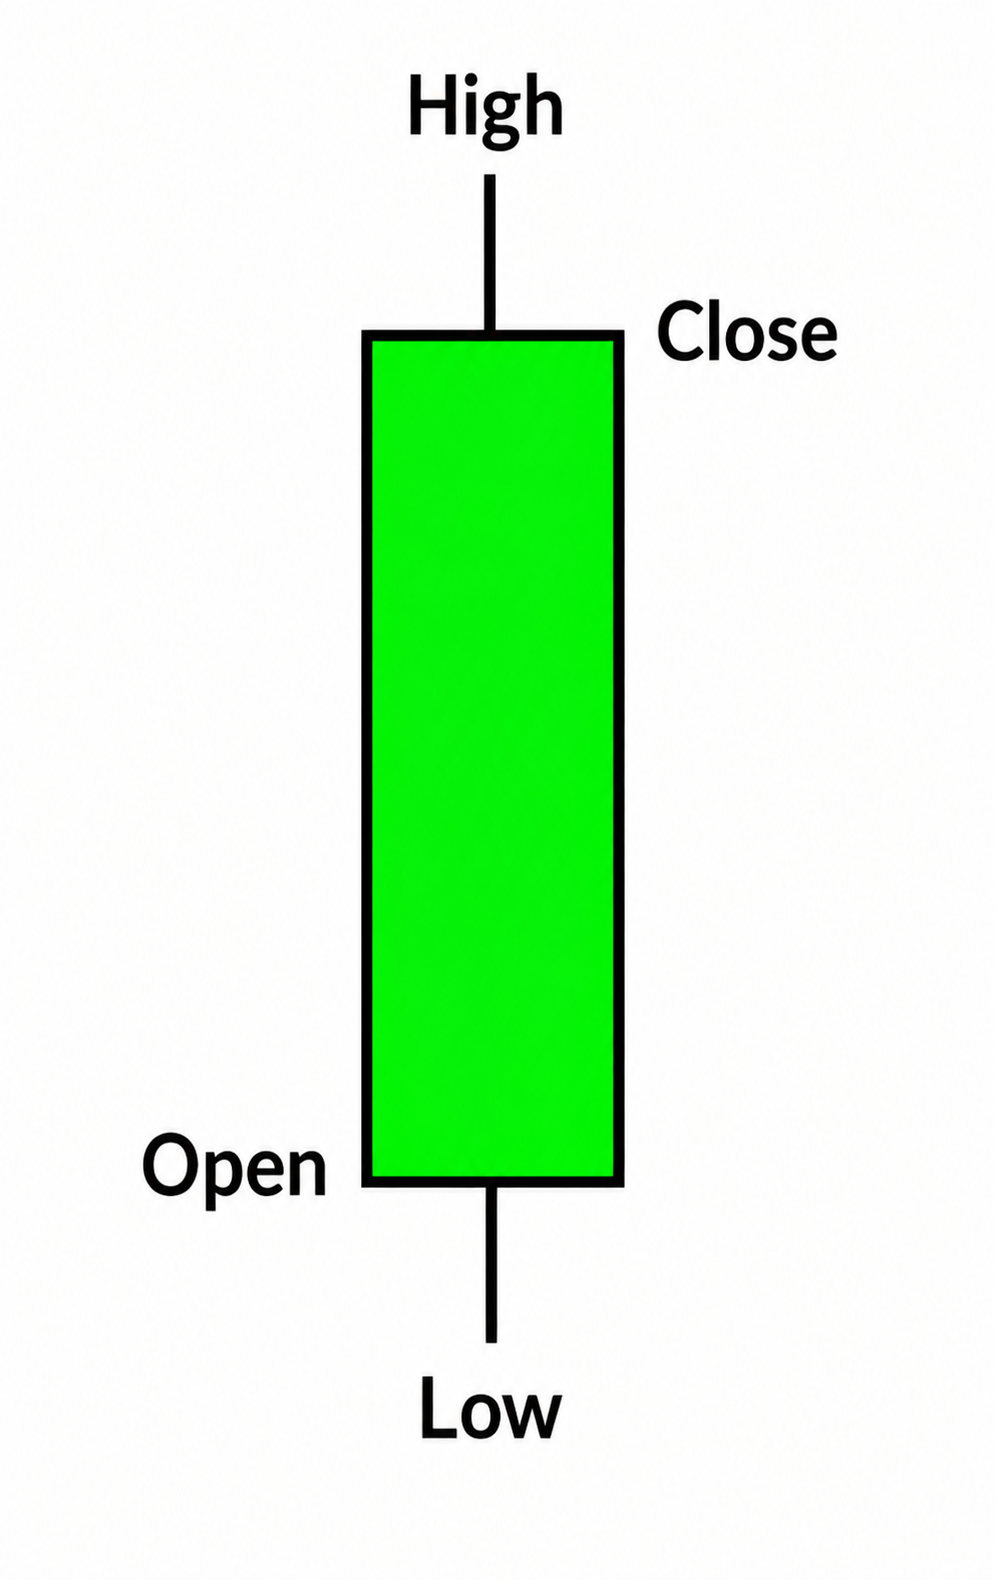
A bullish candle forms when the closing price is higher than the opening price.
🔴 Bearish Candlestick
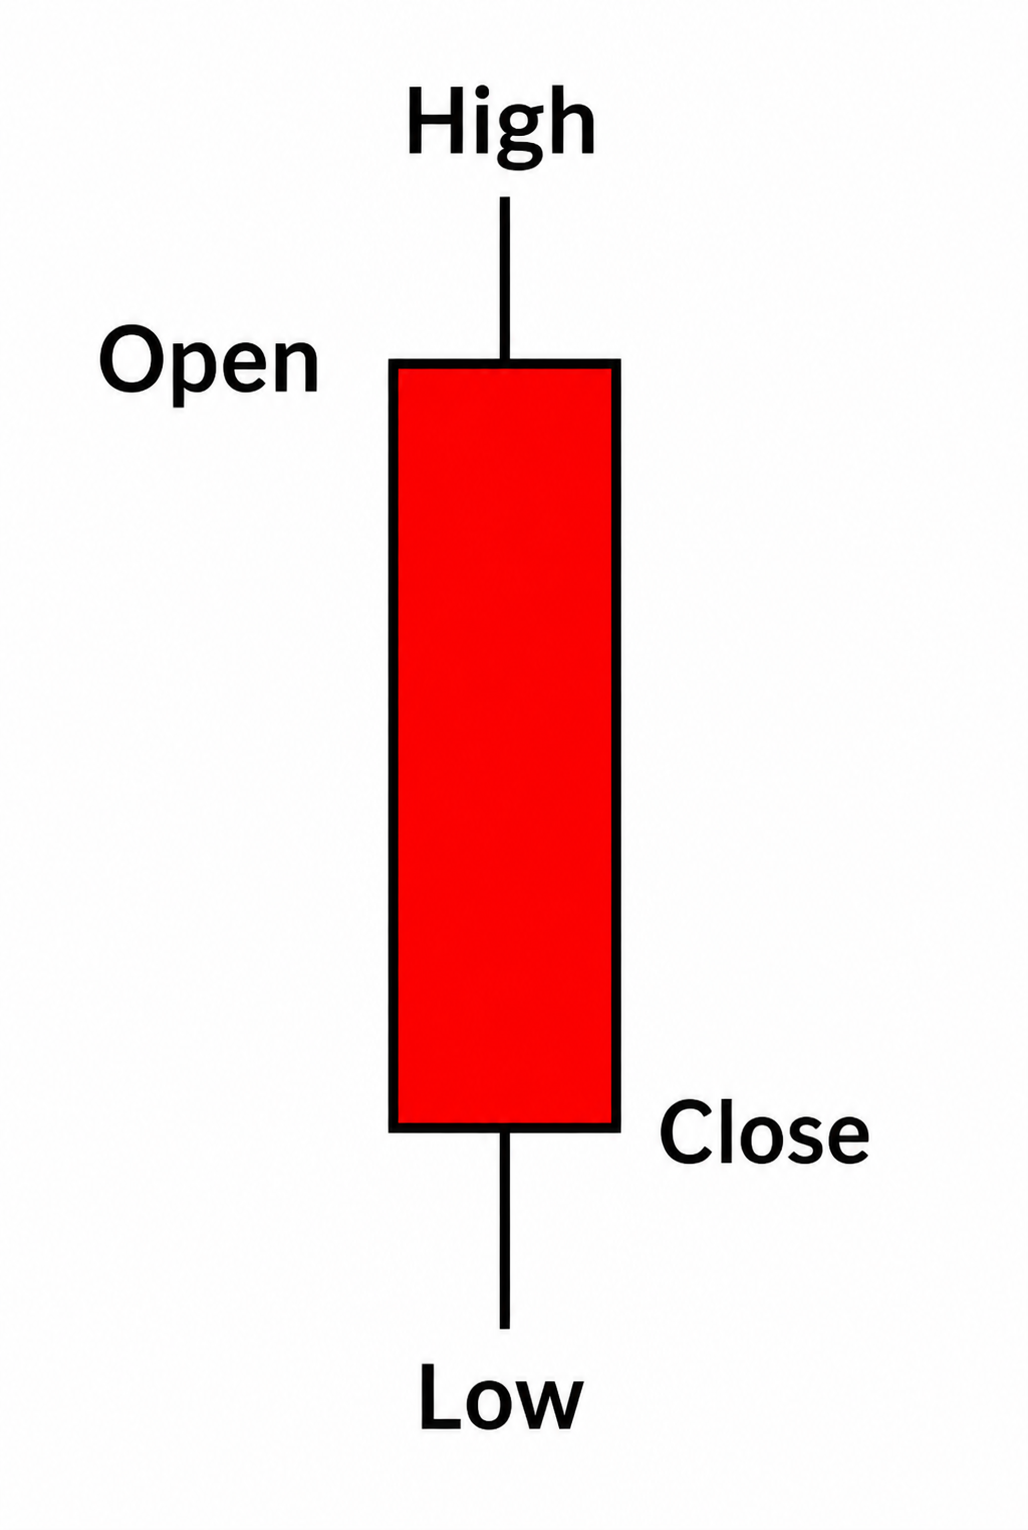
A bearish candle forms when the closing price is lower than the opening price.
⏱️ Candlesticks Change with Timeframe
A candlestick represents different durations depending on the selected chart timeframe.
🎯 Why Candlestick Charts Matter
Candlesticks allow traders to understand market psychology by showing how buyers and sellers interacted during a trading session. Large bullish candles often reflect strong demand, while large bearish candles indicate aggressive selling. Small candles and long wicks may signal hesitation, rejection, or indecision.
💡 Common Mistakes
Many beginners make these mistakes:
A candlestick represents the battle between buyers and sellers during a specific period. By understanding the Open, High, Low, and Close (OHLC) values, traders can better interpret market behaviour and prepare for learning candlestick patterns in the next chapter.
🕯️ Candlestick Patterns
Candlestick patterns are formed by one or more candlesticks and help traders understand the ongoing battle between buyers and sellers. While a single candle provides information about one trading session, candlestick patterns reveal shifts in market sentiment that may signal trend continuation or a possible reversal.
📊 What are Candlestick Patterns?
Candlestick patterns are recurring price formations created by one or more candles.
🔄 Types of Candlestick Patterns
Candlestick patterns are generally divided into two categories.
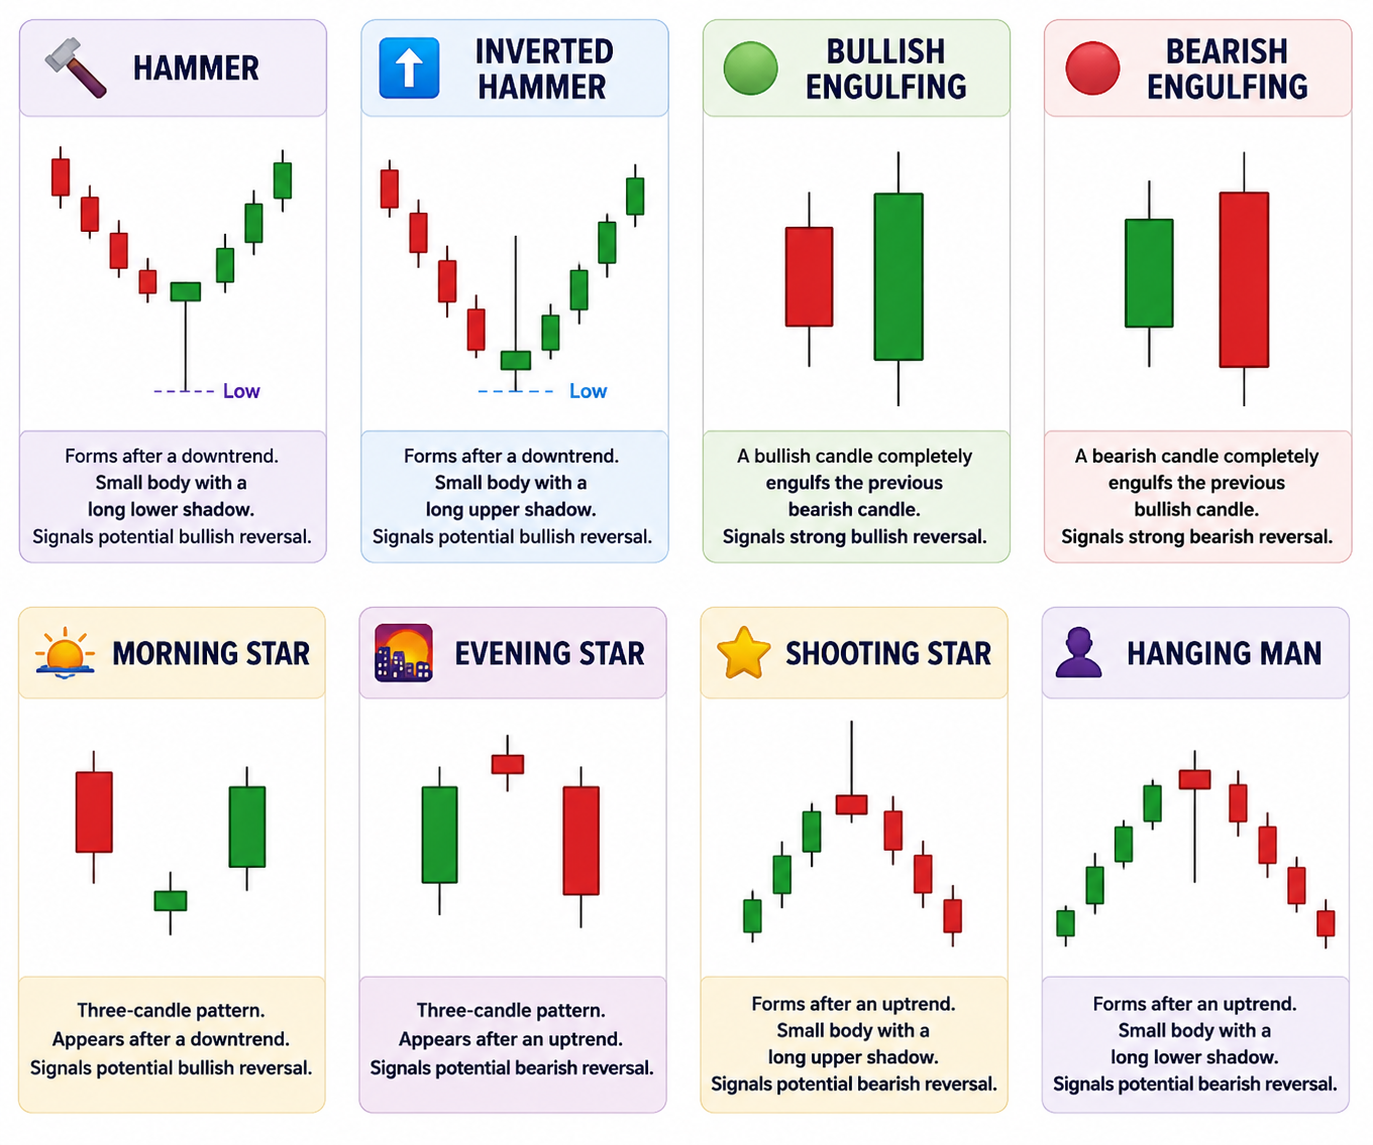
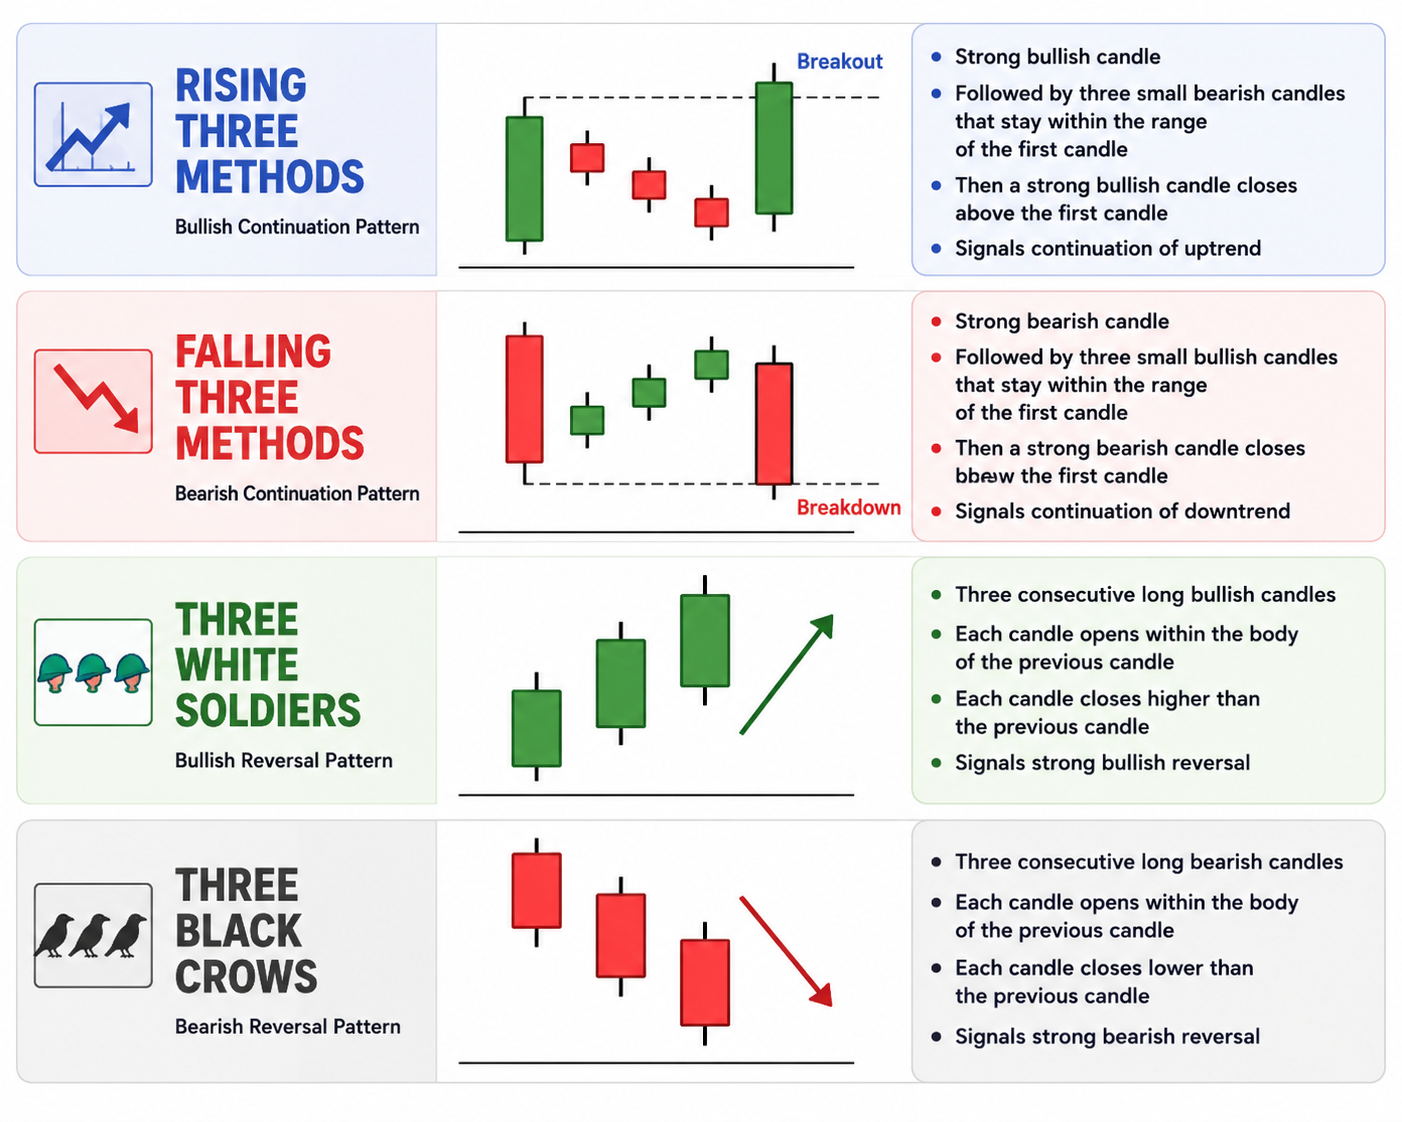
🟢 Bullish Reversal Patterns
🔨 Hammer
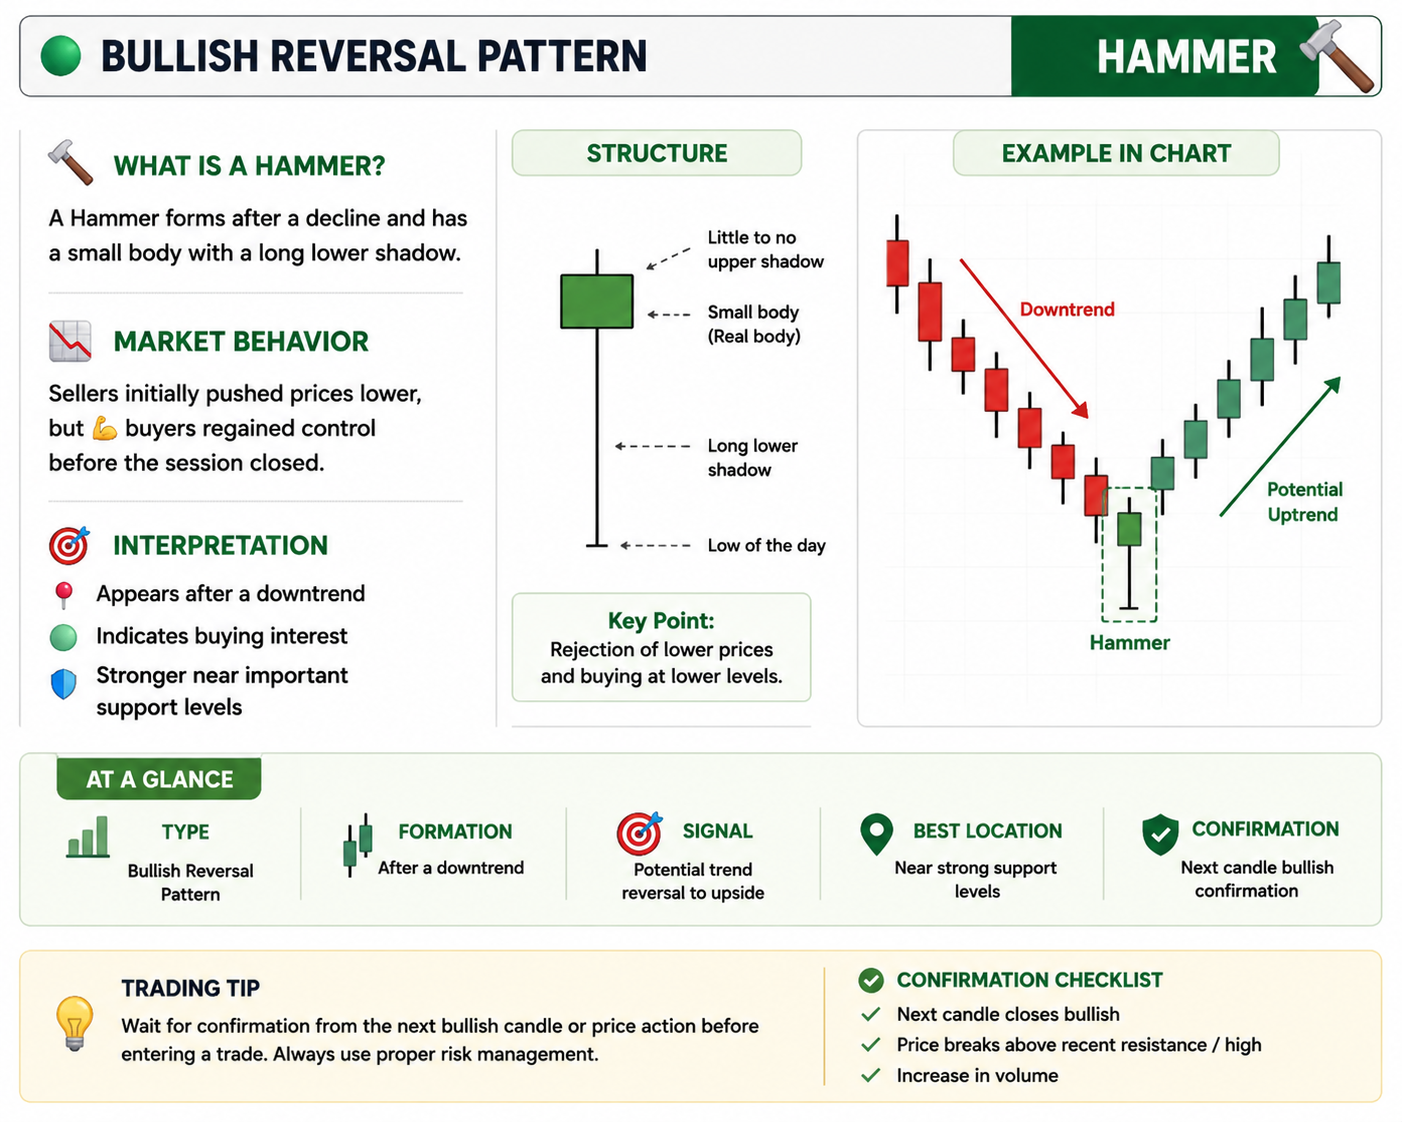
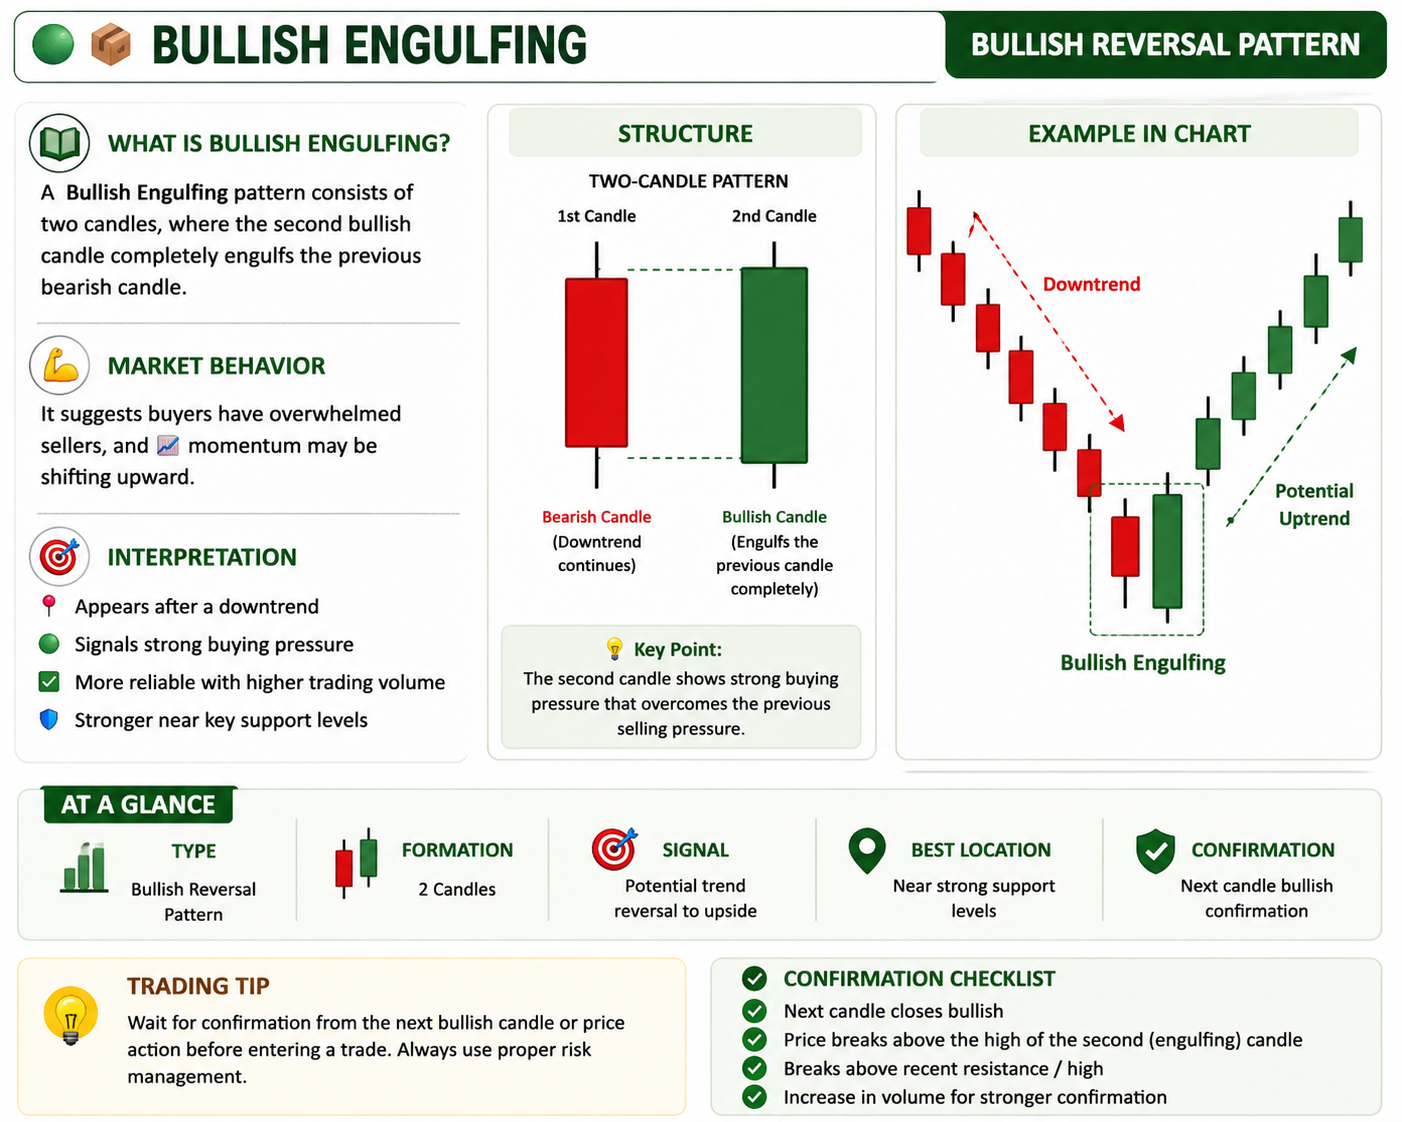
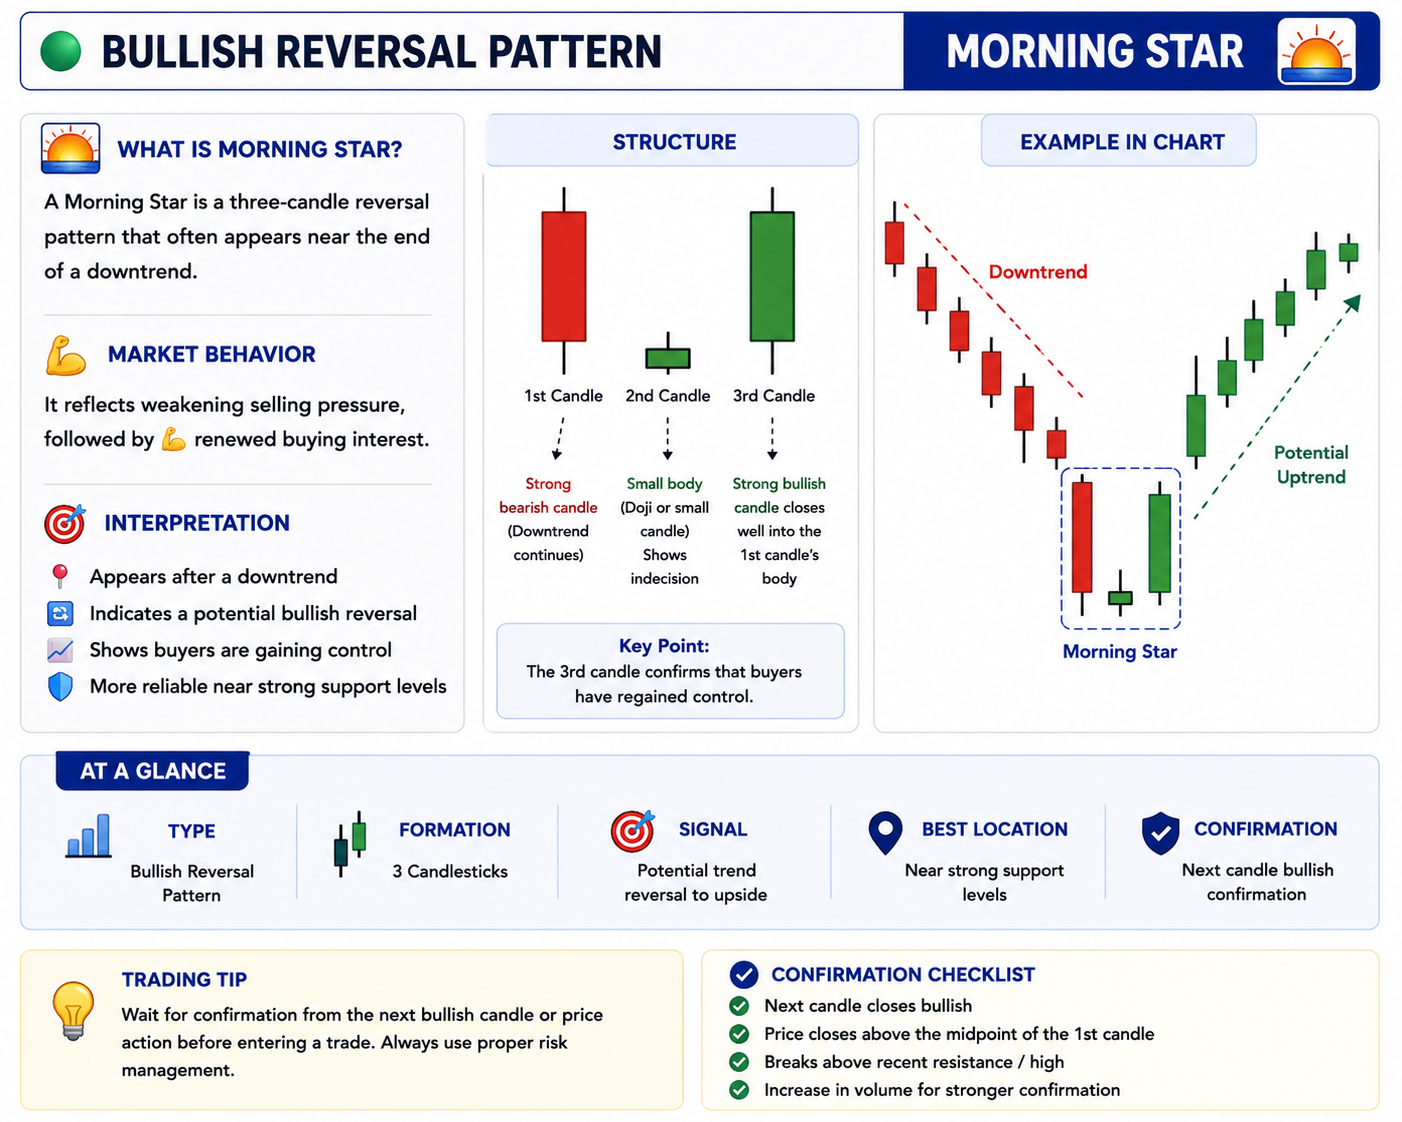
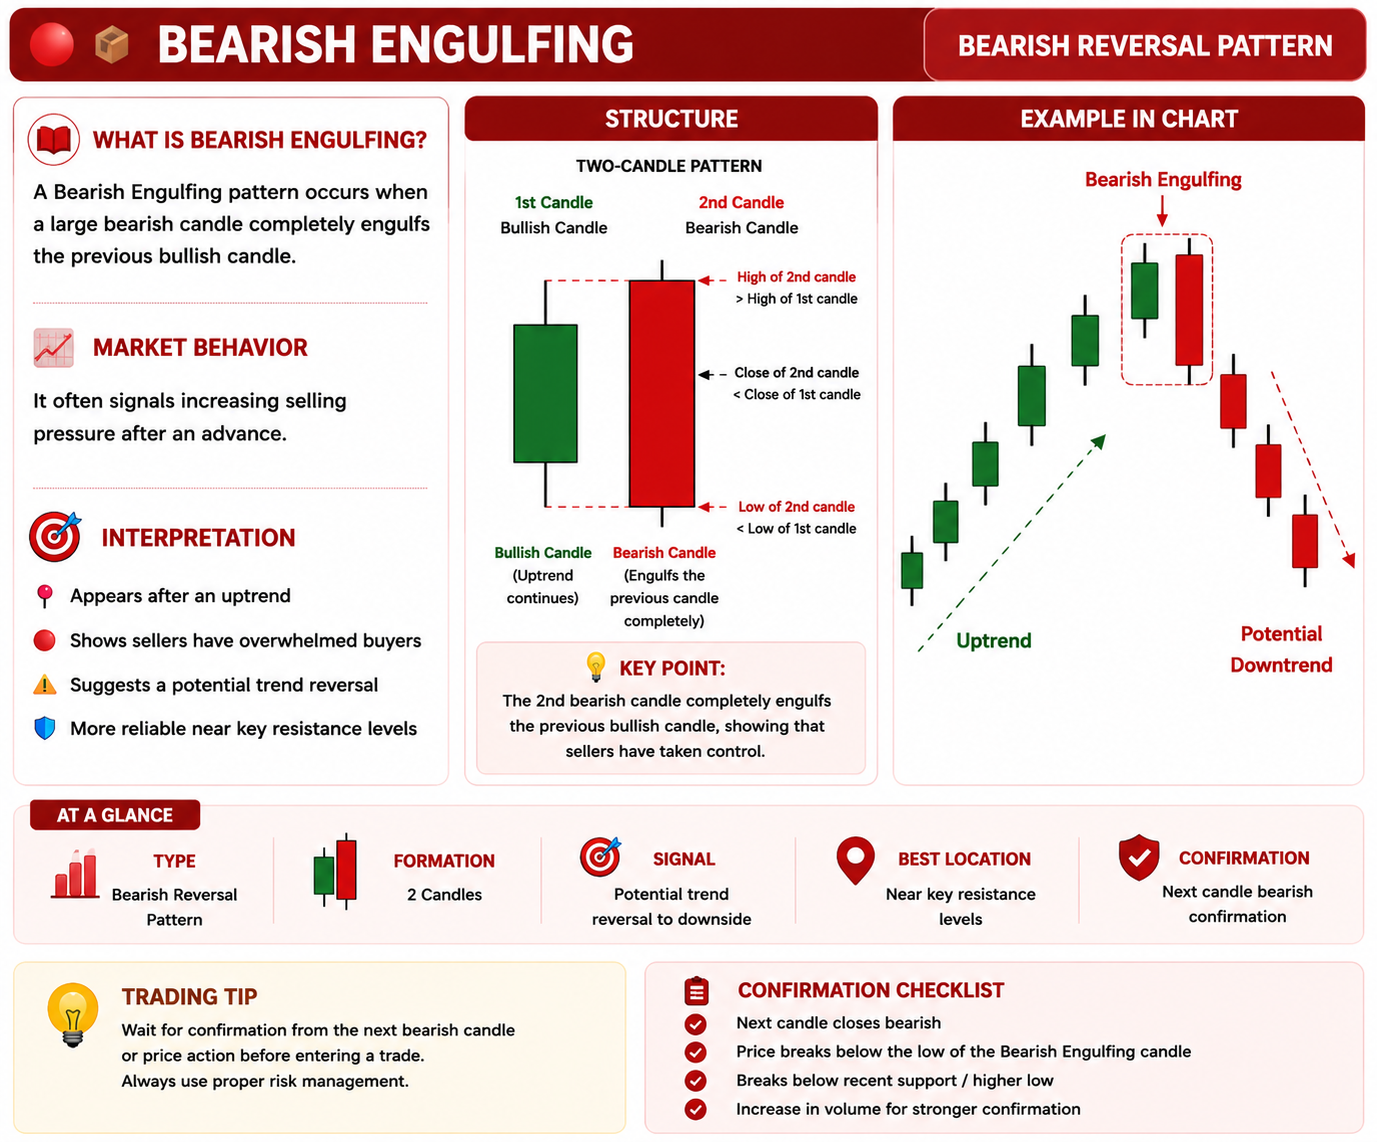
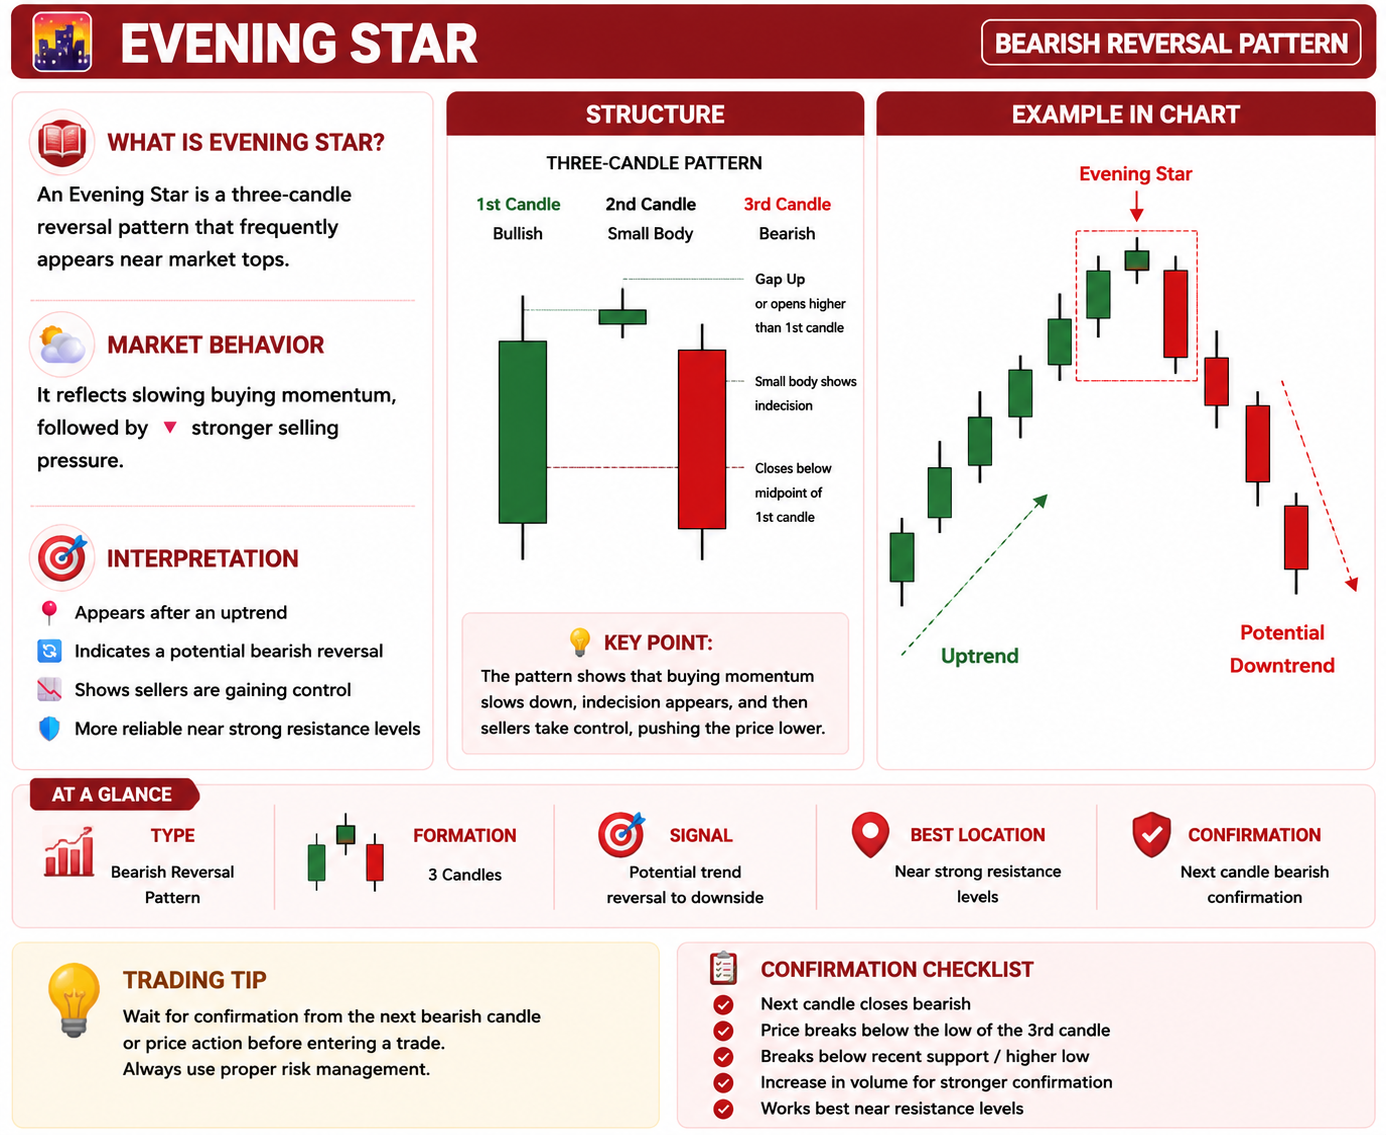
🔴 Bearish Reversal Patterns
⭐ Shooting Star
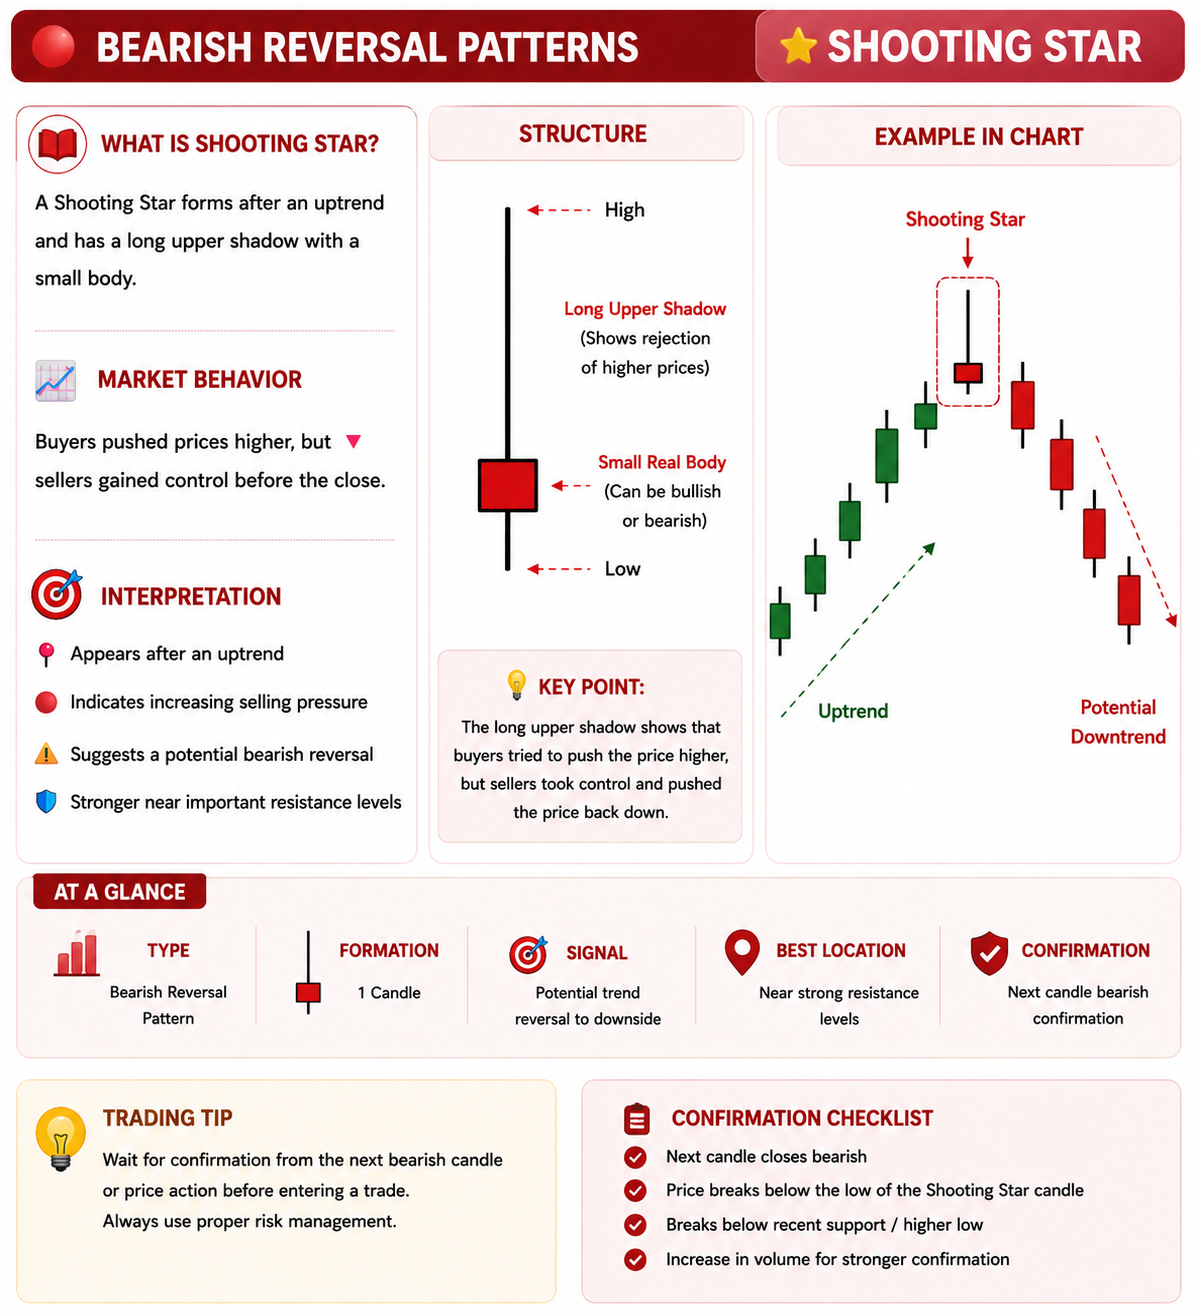
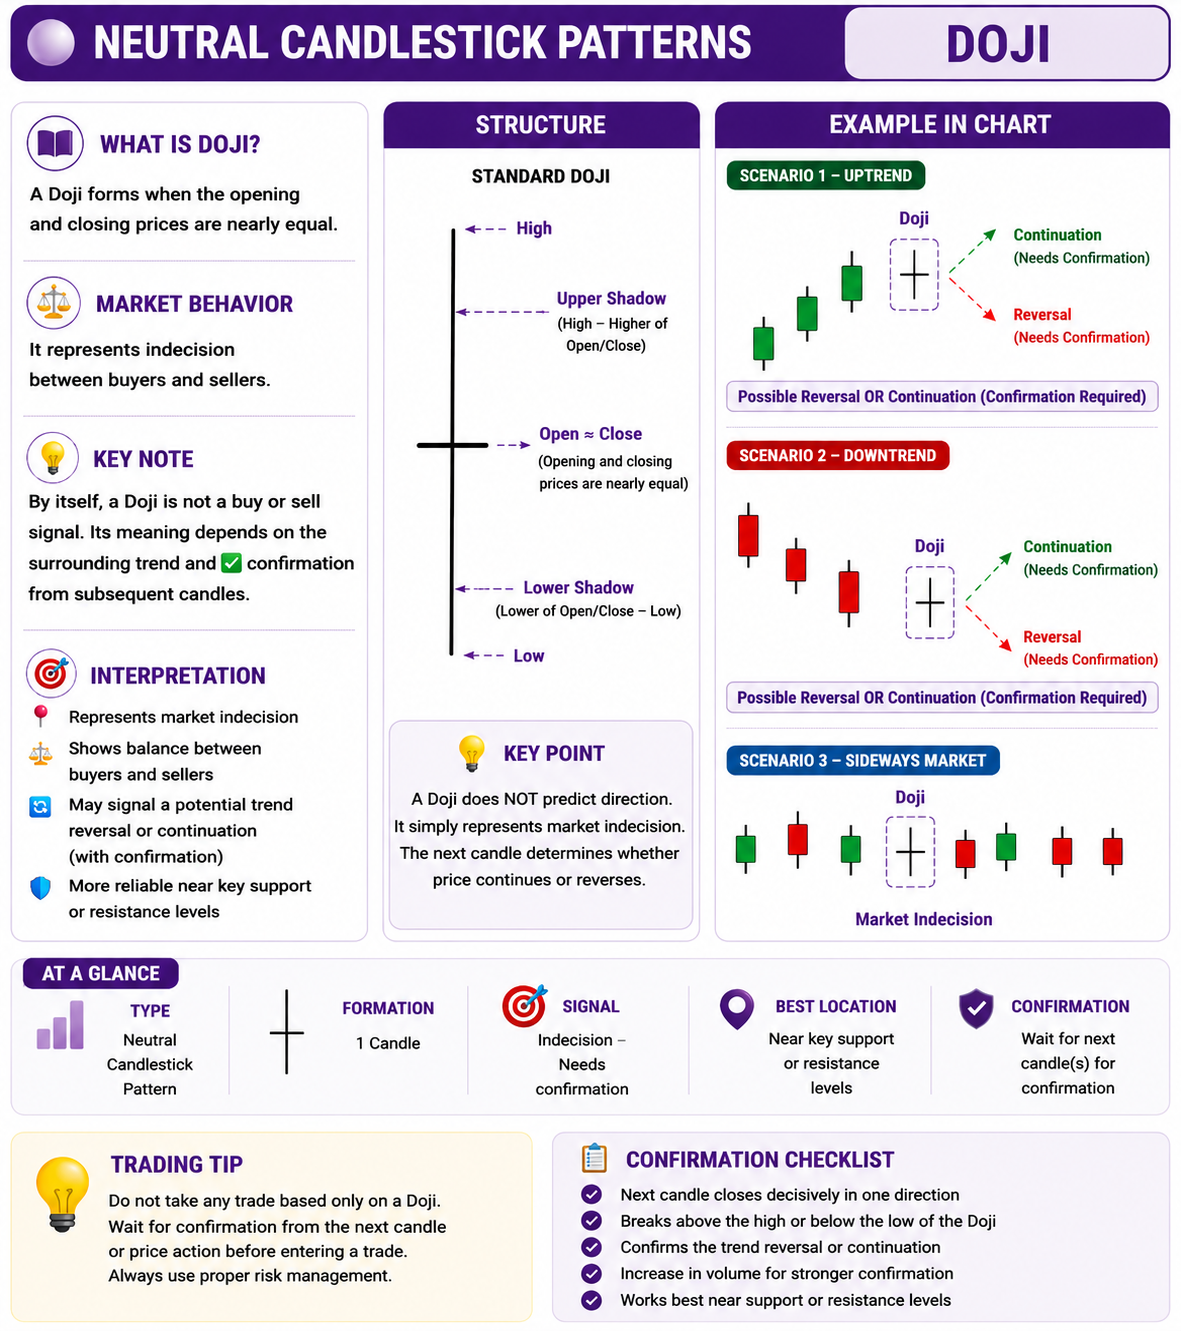
⚪ Neutral Candlestick Patterns
📍 Doji
⚠️ Common Mistakes
Many beginners misuse candlestick patterns.
✅ Best Way to Use Candlestick Patterns
Professional traders rarely rely on candlestick patterns alone.
Candlestick patterns help traders understand changes in market psychology, but they should never be used in isolation. The highest probability trades occur when candlestick patterns align with the prevailing trend, key price levels, and strong market context.
📊 Support & Resistance
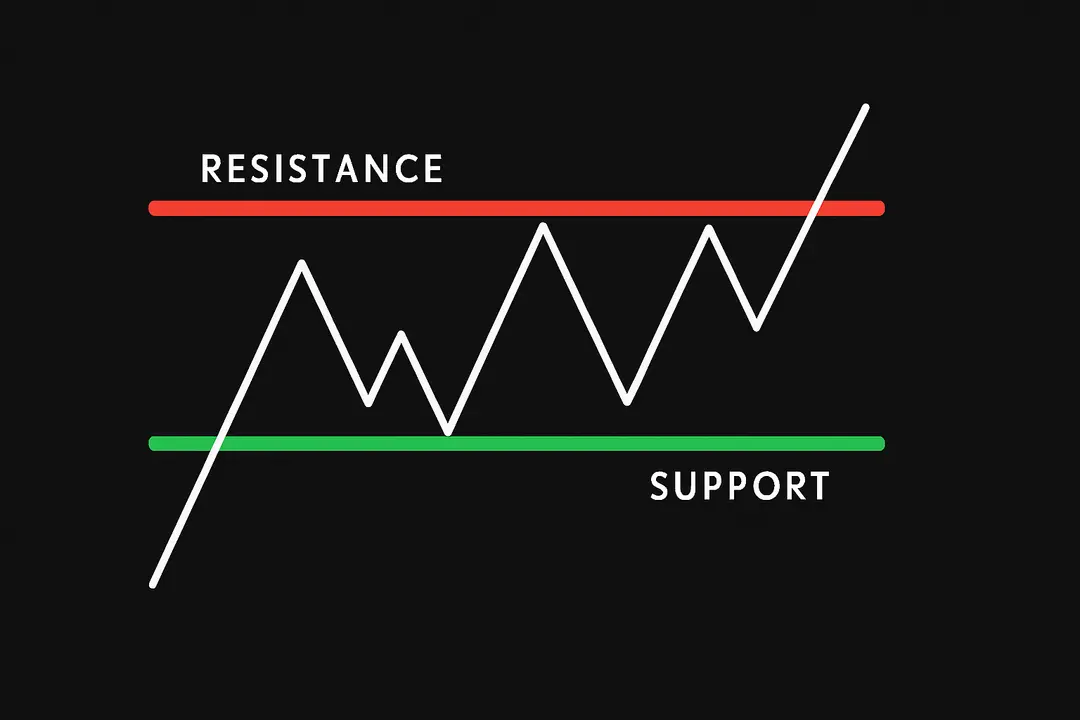
📈 What is Support?
📉 What is Resistance?
🏗️ Why Do Support & Resistance Form?
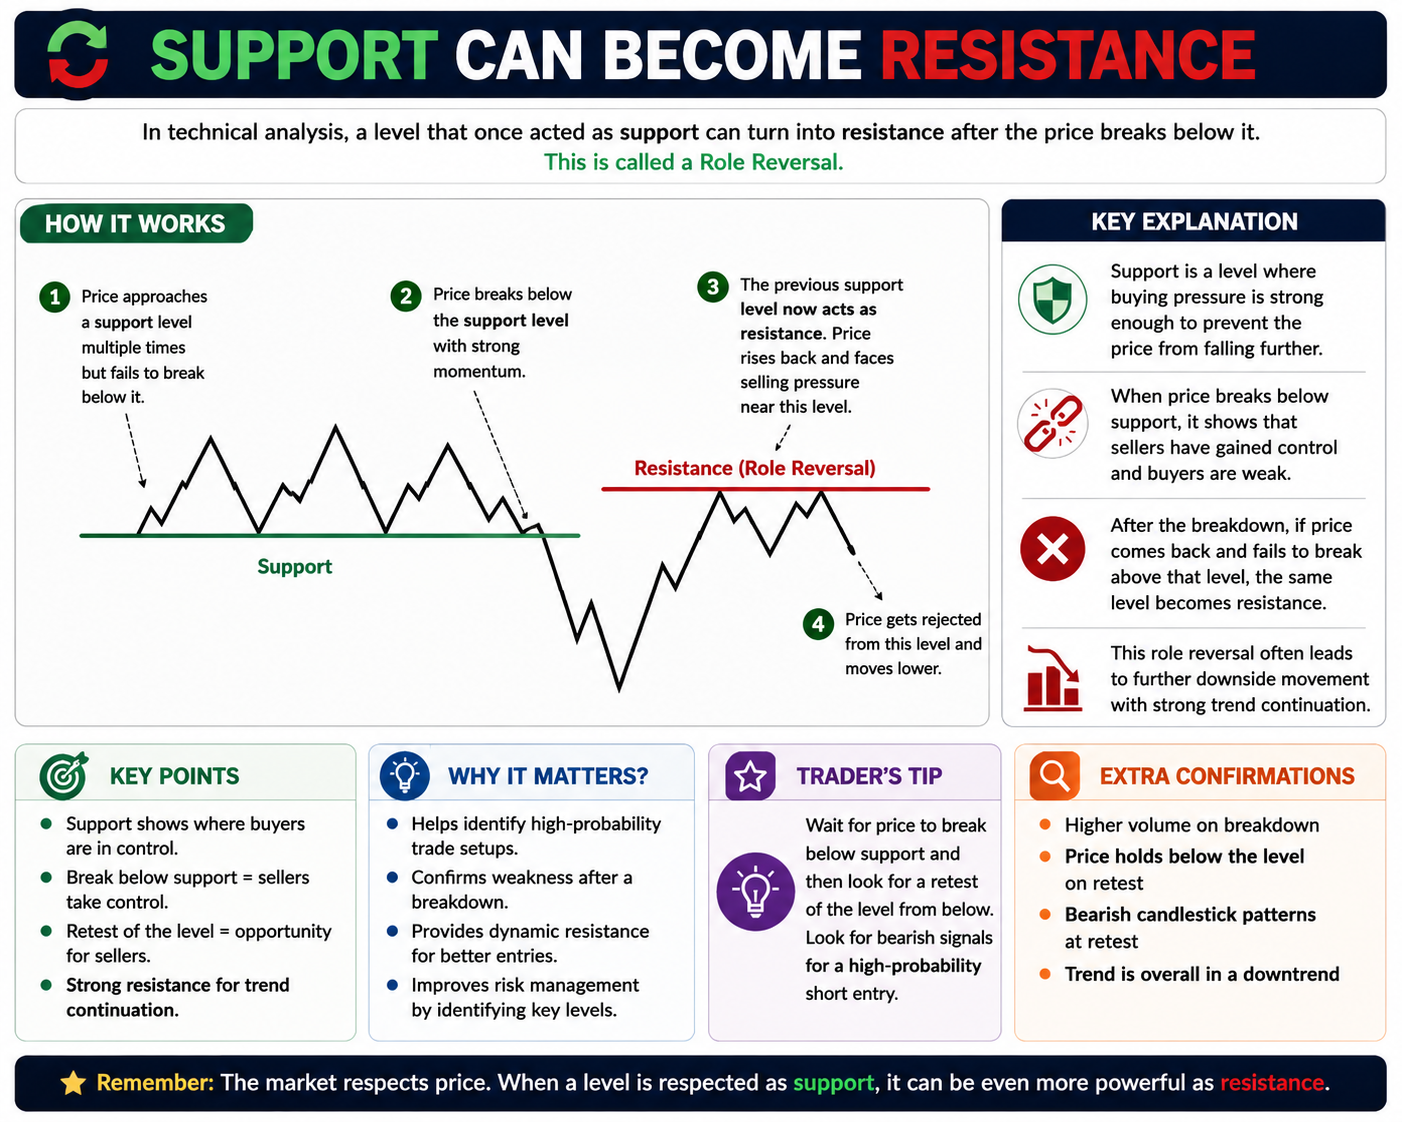
🔄 Support Can Become Resistance
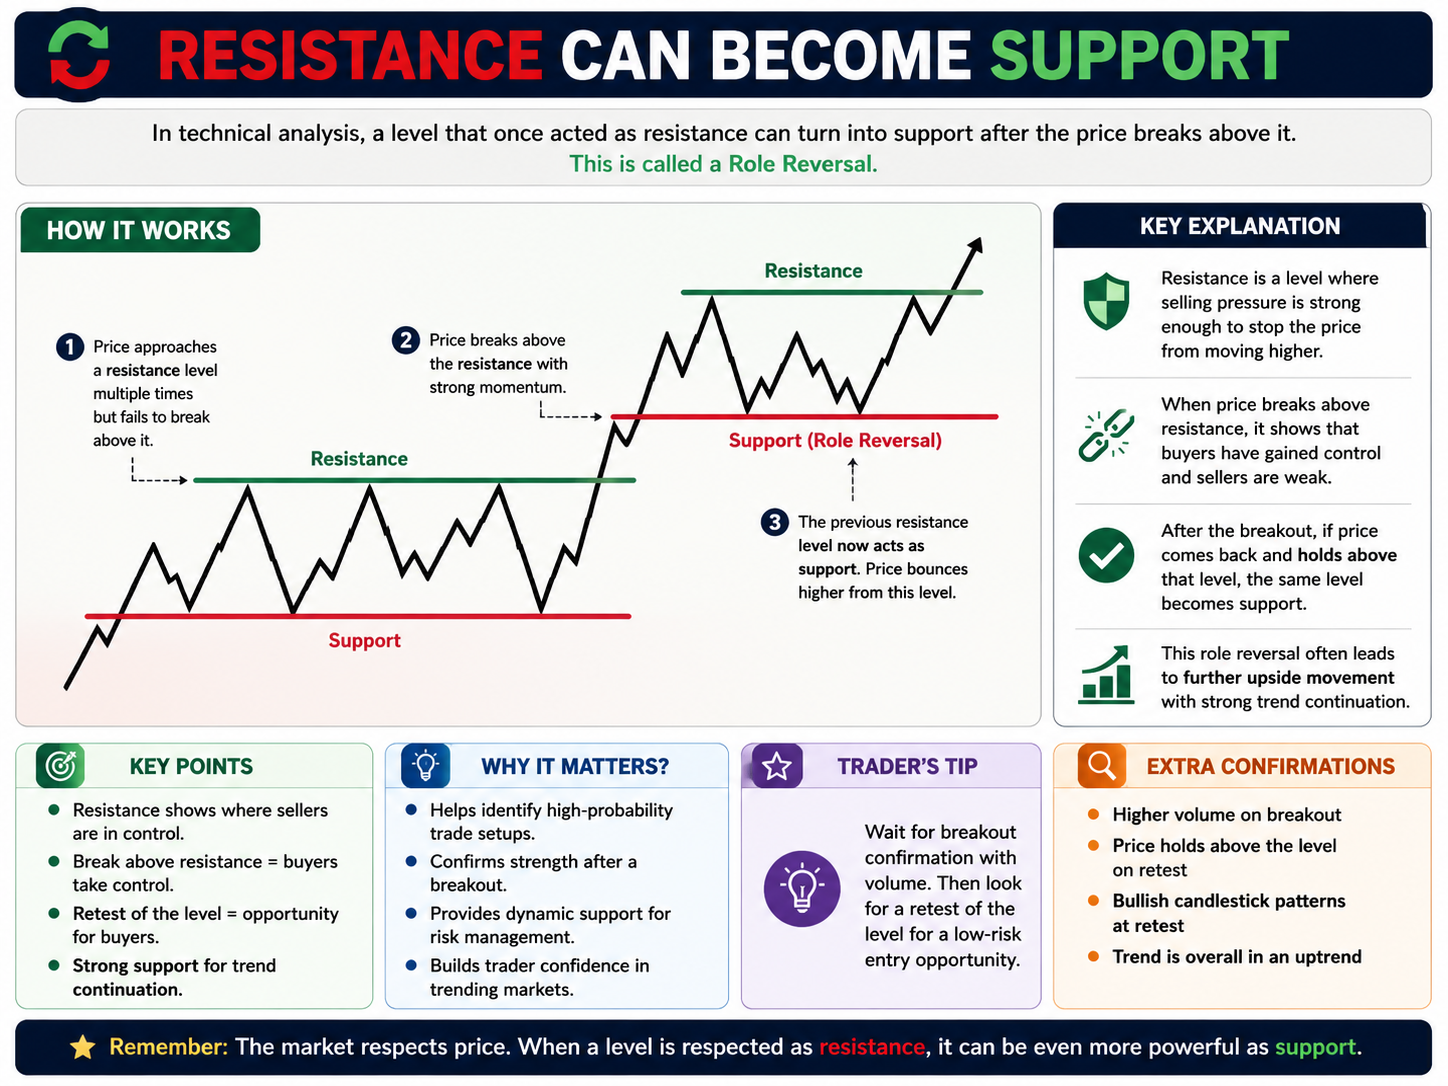
🔁 Resistance Can Become Support
📊 Types of Support & Resistance
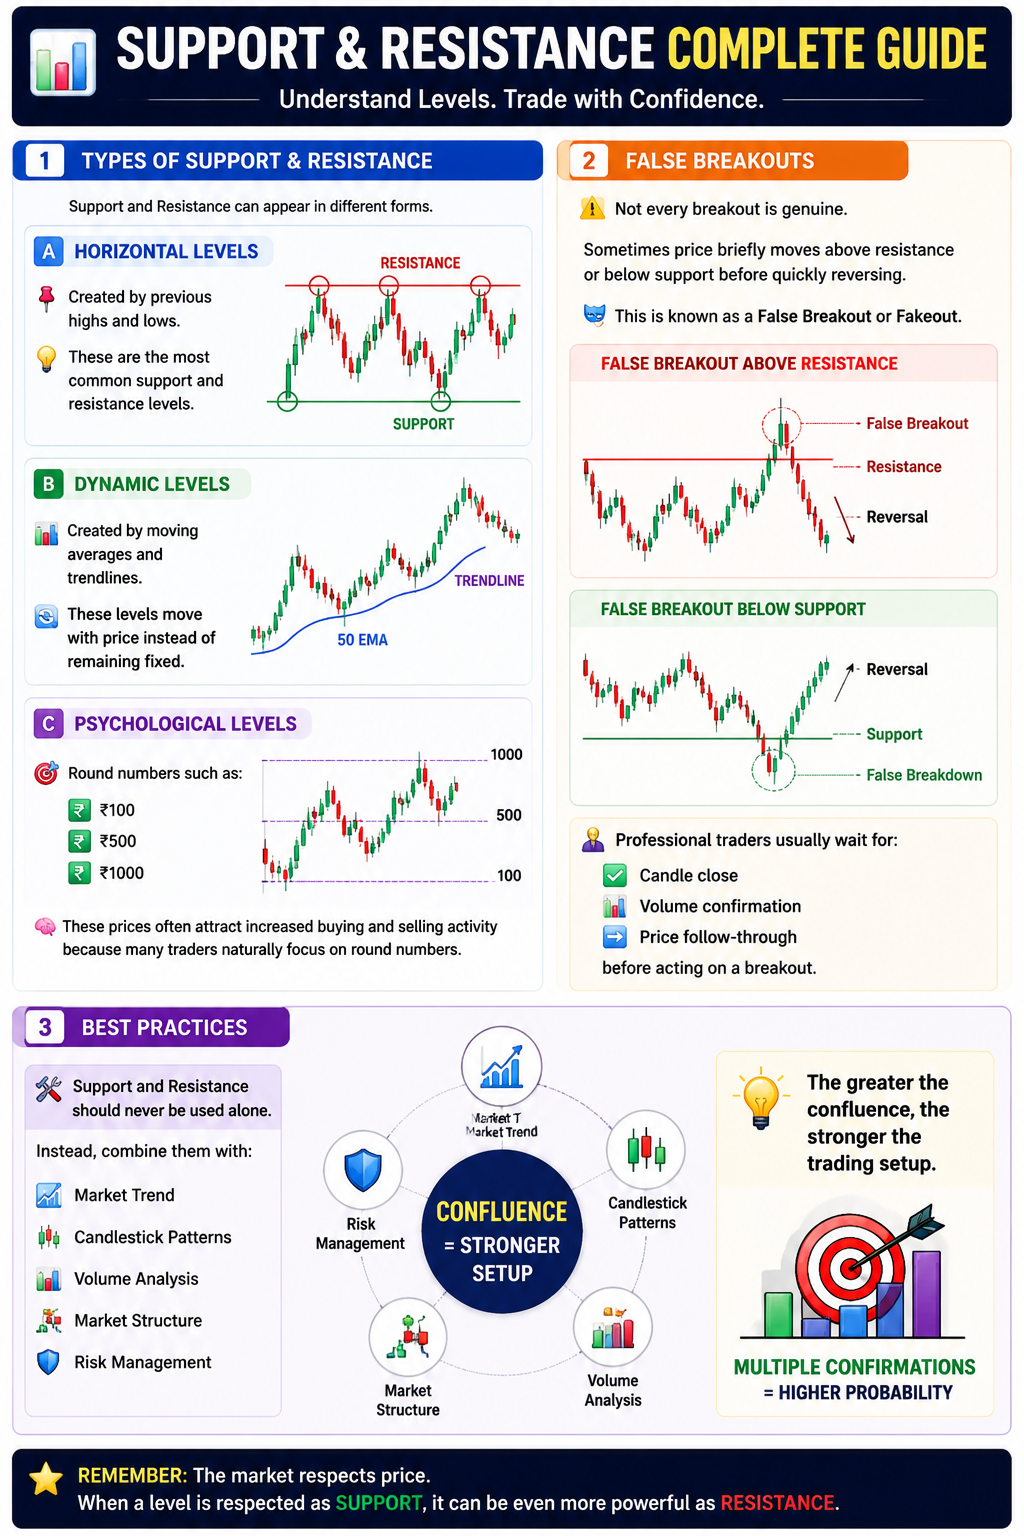
🚫 Common Mistakes
Support and Resistance represent areas where buyers and sellers have previously taken control. They are not exact price levels but decision zones where price is more likely to react. Successful traders use these levels together with trend, volume, and price action to make informed trading decisions rather than relying on them in isolation.
📦 Demand & Supply
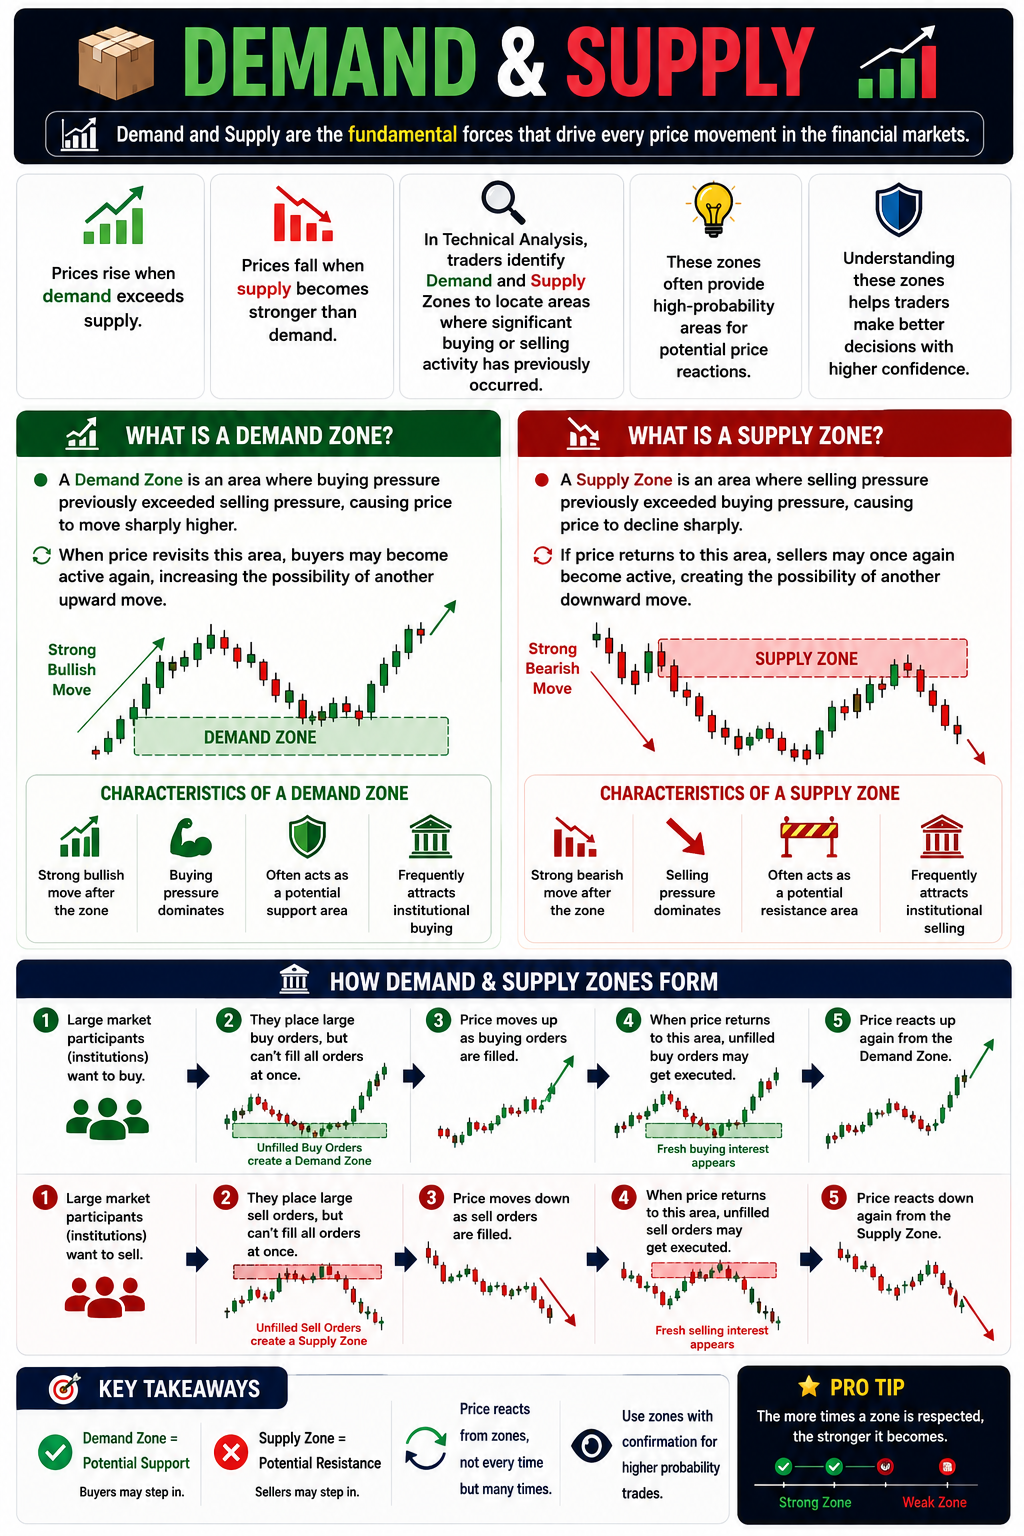
📈 What is a Demand Zone?
📉 What is a Supply Zone?
🔍 How Demand & Supply Zones Form
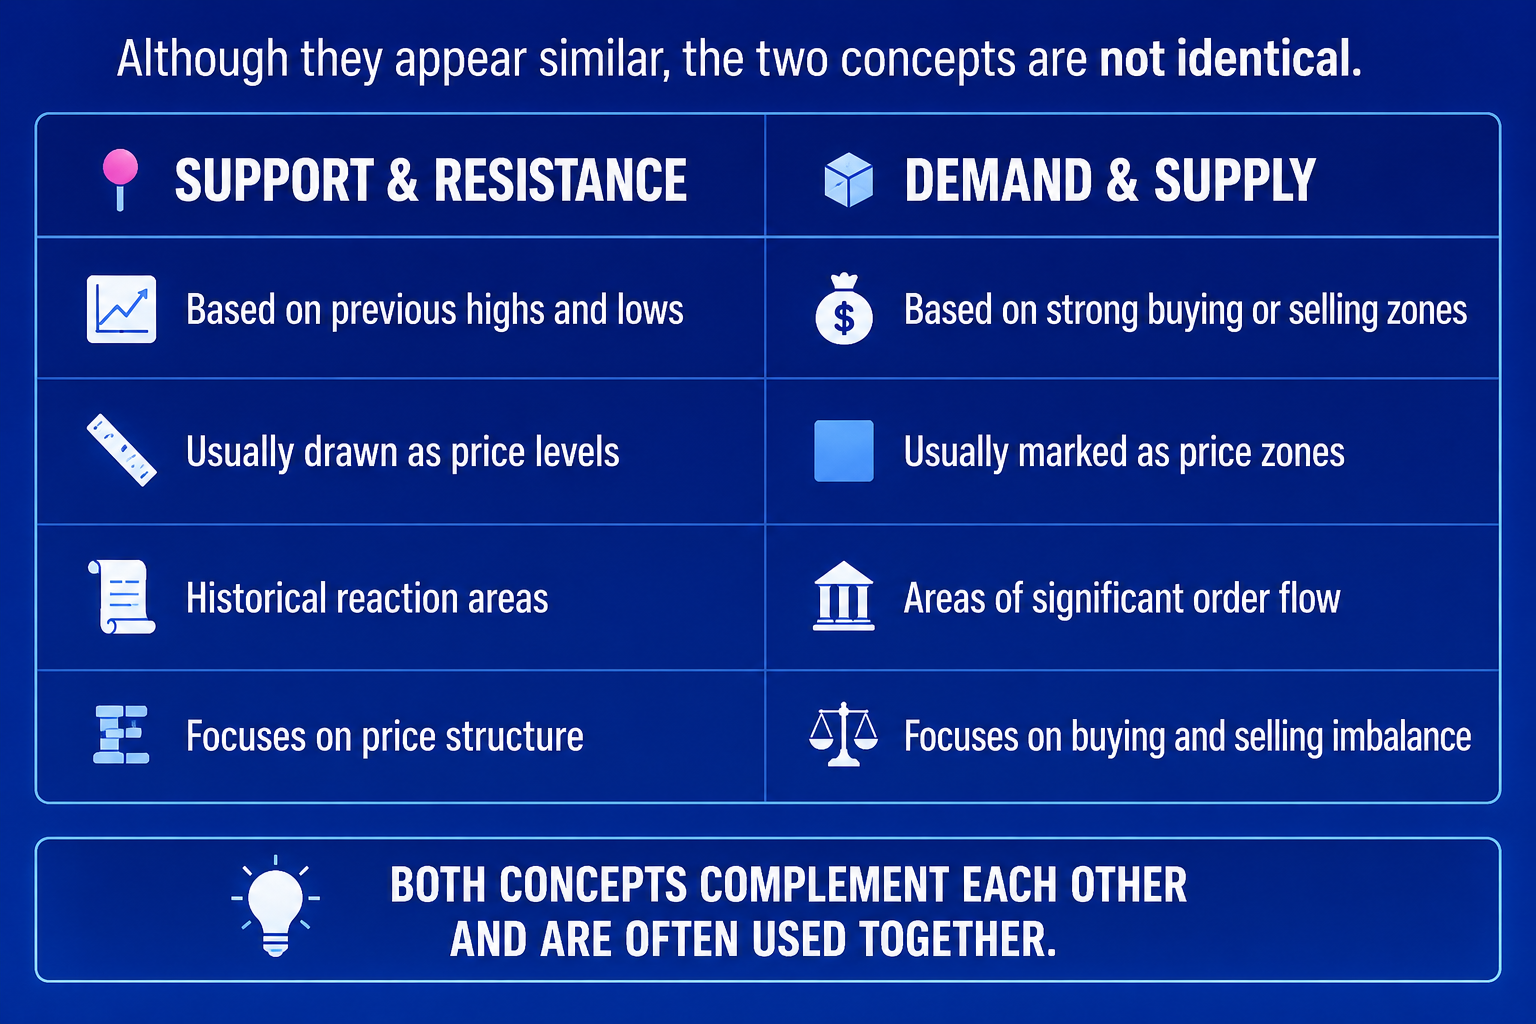
📊 Demand & Supply vs Support & Resistance
📍 Fresh vs Tested Zones
⚠️ Common Mistakes
💡 Best Practices
Demand and Supply zones represent areas where strong buying or selling activity has previously influenced price movement. Instead of treating them as exact price levels, traders should view them as zones of potential market interest and always seek confirmation before making trading decisions.
📊 Volume Analysis
- 📈 Volume is one of the most valuable tools in Technical Analysis because it measures the level of market participation behind a price move.
📊 While price tells us the direction of the market, volume helps us understand the strength and conviction behind that movement.
💡 A price move supported by strong volume is generally considered more reliable than a move occurring on low volume.
📈 What is Volume?
📊 Volume represents the total number of shares traded during a specific period.
🤝 Every completed transaction consists of a buyer and a seller, and each transaction contributes to the total trading volume.
📈 Higher volume indicates greater market activity, while 📉 lower volume suggests limited participation.
🎯 Why Volume Matters
📊 Volume helps traders answer an important question:
❓ "How much conviction is behind this price movement?"
📈 A strong price move accompanied by high volume often indicates broad market participation.
📉 A similar move on low volume may lack strength and be less reliable.
📊 Price and Volume Relationship
The relationship between price and volume provides valuable insights into market behaviour.
📈 Rising Price + Rising Volume
🟢 Strong buying participation
🚀 Healthy upward momentum
✅ Trend is more likely to continue
📉 Falling Price + Rising Volume
🔴 Strong selling pressure
📊 Increased market participation
⬇️ Downtrend may strengthen
📈 Rising Price + Falling Volume
⚠️ Buying momentum is weakening
👥 Fewer participants support the move
❓ Trend continuation becomes less certain
📉 Falling Price + Falling Volume
📉 Selling pressure is reducing
😴 Market participation is low
↔️ Price may enter a consolidation phase
🚀 Volume During Breakouts
📈 Breakouts become more reliable when supported by higher-than-average volume.
💪 A breakout with strong volume suggests that many market participants support the move, increasing the likelihood of continuation.
⚠️ On the other hand, breakouts with weak volume are more likely to fail and reverse.
🔄 Volume During Consolidation
↔️ During sideways markets, trading volume often declines as buyers and sellers reach a temporary balance.
📈 A subsequent increase in volume during a breakout from the range may indicate the beginning of a new trend.
⚠️ Volume Spikes
🚀 Occasionally, trading volume increases sharply within a short period.
📌 Volume spikes may occur because of:
📰 Important company announcements
📑 Quarterly earnings
🌍 Major news events
🏦 Strong institutional participation
💡 A volume spike alone does not predict direction, but it signals increased market interest.
💡 Best Practices
📊 Volume should always be analysed alongside price action.
Combine volume with:
📈 Market Trend
📍 Support & Resistance
📦 Demand & Supply
🕯️ Candlestick Patterns
📐 Chart Patterns
💡 Looking at volume in isolation can lead to misleading conclusions.
🚫 Common Mistakes
Many beginners make these mistakes:
❌ Ignoring volume completely
❌ Buying every high-volume candle without context
❌ Assuming high volume always means prices will rise
❌ Focusing only on price while ignoring market participation
💡 Volume confirms price—it does not replace it.
Volume measures the level of participation behind every price movement. When analysed together with price action, it helps traders evaluate the strength of trends, identify reliable breakouts, and avoid weak market moves. Rather than predicting the future, volume helps confirm what the market is already communicating.
📊 Chart Patterns
- 📈 Chart patterns are recurring price formations that develop over time as buyers and sellers interact in the market.
⚖️ These patterns help traders understand the balance between demand and supply and identify potential trend continuation or trend reversal.
💡 Since market psychology tends to repeat, similar price patterns often appear across different stocks, indices, and timeframes.
📈 What are Chart Patterns?
📊 A chart pattern is a recognizable formation created by multiple candlesticks over a period of time.
These patterns help traders:
🏗️ Identify the current market structure
📈 Recognize potential trend continuation
🔄 Spot possible trend reversals
🎯 Plan entries and exits with greater confidence
💡 Chart patterns should always be confirmed with trend, volume, and price action.
🔄 Types of Chart Patterns
📚 Chart patterns are generally classified into two categories:
➡️ Continuation Patterns – Suggest that the existing trend is likely to continue after a temporary pause.
🔄 Reversal Patterns – Indicate that the current trend may be weakening and a new trend could emerge.
💡 Understanding the difference helps traders align their decisions with market behaviour.
📈 Continuation Patterns
📊 Continuation patterns appear when the market pauses before resuming its existing trend.
🔺 Ascending Triangle
📈 An Ascending Triangle forms when price creates higher lows while repeatedly facing resistance at a similar level.
💪 It often reflects increasing buying pressure and may lead to an upward breakout.
Interpretation
📍 Appears during an uptrend
📈 Buyers become increasingly aggressive
🚀 Potential bullish breakout
📊 Stronger with high breakout volume
🔻 Descending Triangle
📉 A Descending Triangle develops when price forms lower highs while support remains relatively flat.
🔻 It often indicates increasing selling pressure and may result in a downward breakout.
Interpretation
📍 Appears during a downtrend
📉 Sellers become increasingly aggressive
⬇️ Potential bearish breakout
📊 Stronger with high breakout volume
🔶 Symmetrical Triangle
⚖️ A Symmetrical Triangle forms when both highs and lows gradually converge.
🤝 Neither buyers nor sellers have complete control, and price eventually breaks out in one direction as momentum builds.
Interpretation
📍 Represents market consolidation
⚖️ Balance between buyers and sellers
🚀 Breakout can occur in either direction
📊 Confirmation requires volume
🚩 Flag Pattern
🚩 A Flag is a short consolidation that follows a strong price move.
⏸️ It represents a temporary pause before the prevailing trend potentially resumes.
Interpretation
📍 Appears after a strong trend
⏳ Temporary consolidation
➡️ Suggests trend continuation
📊 Stronger with breakout volume
🔄 Reversal Patterns
📉 Reversal patterns suggest that the existing trend may be approaching exhaustion.
🔝 Double Top
🔝 A Double Top forms after an uptrend when price fails to move above a previous high twice.
📉 It often signals weakening buying momentum and a possible bearish reversal.
Interpretation
📍 Appears after an uptrend
🔴 Buying momentum weakens
🔄 Potential bearish reversal
📊 More reliable with neckline breakdown
🔻 Double Bottom
🔻 A Double Bottom develops after a downtrend when price successfully holds a support level twice.
🟢 It suggests selling pressure may be weakening and buyers could regain control.
Interpretation
📍 Appears after a downtrend
💪 Buyers defend support
🔄 Potential bullish reversal
📊 More reliable with neckline breakout
👤 Head and Shoulders
👤 The Head and Shoulders pattern consists of three peaks, with the middle peak being the highest.
📉 It is widely recognised as a bearish reversal pattern that may indicate the end of an uptrend.
Interpretation
📍 Appears after an uptrend
📉 Signals weakening bullish momentum
🔄 Potential bearish reversal
📊 Confirmation comes after neckline breakdown
🔄 Inverse Head and Shoulders
📈 The Inverse Head and Shoulders is the bullish counterpart of the Head and Shoulders pattern.
🟢 It forms after a downtrend and may indicate the beginning of a new upward trend.
Interpretation
📍 Appears after a downtrend
💪 Buyers gradually regain control
🚀 Potential bullish reversal
📊 Confirmation comes after neckline breakout
📊 Importance of Breakout Confirmation
⚠️ A chart pattern is not considered complete until price breaks above or below its key boundary.
👨💼 Professional traders often wait for:
✅ A decisive breakout
📊 Strong trading volume
🕯️ Confirmation through candle close
💡 Waiting for confirmation helps reduce the probability of false breakouts.
⚠️ Common Mistakes
Many beginners make these mistakes:
❌ Identifying patterns before they are fully formed
❌ Entering trades before breakout confirmation
❌ Ignoring the overall market trend
❌ Ignoring trading volume
❌ Assuming every pattern will succeed
💡 No chart pattern guarantees future price movement.
💡 Best Practices
📊 Chart patterns become more reliable when combined with:
📈 Market Trend
📍 Support & Resistance
📦 Demand & Supply
📊 Volume Analysis
🕯️ Candlestick Confirmation
🛡️ Risk Management
🎯 The strongest trading setups occur when multiple technical factors align.
Chart patterns represent recurring formations created by market psychology and price behaviour. While they help traders identify potential continuation and reversal opportunities, they should always be confirmed using trend, volume, and overall market context. Successful trading comes from combining chart patterns with disciplined analysis rather than relying on any single formation.
📊 Technical Indicators
- 📈 Technical indicators are mathematical calculations based on a stock's price, volume, or both.
📊 They help traders analyse market behaviour, identify trends, measure momentum, and evaluate the strength of price movements.
💡 Indicators do not predict the future. Instead, they provide additional information that helps traders make more informed decisions.
📈 What are Technical Indicators?
🧮 A technical indicator is a tool that processes historical market data and presents it in a visual format.
Indicators help traders:
📈 Identify market trends
🚀 Measure momentum
⚖️ Detect potential overbought or oversold conditions
✅ Confirm trading signals
🎯 Improve decision-making
💡 Indicators should always support price analysis—not replace it.
🔄 Types of Technical Indicators
Most technical indicators can be grouped into four categories.
📈 Trend Indicators
📊 Trend indicators help determine the overall direction of the market.
Common examples:
📉 Moving Average (MA)
📈 Exponential Moving Average (EMA)
💡 These indicators smooth price fluctuations and make the prevailing trend easier to identify.
🚀 Momentum Indicators
⚡ Momentum indicators measure the speed and strength of price movement.
Common examples:
📊 Relative Strength Index (RSI)
📈 Moving Average Convergence Divergence (MACD)
💡 They help traders understand whether buying or selling momentum is increasing or weakening.
📊 Volume Indicators
📦 Volume indicators analyse trading activity to support price analysis.
Common examples:
📈 On-Balance Volume (OBV)
📊 Volume Moving Average
💡 They help determine whether price movements are supported by strong market participation.
📉 Volatility Indicators
🌊 Volatility indicators measure how much price fluctuates over time.
Common example:
📏 Bollinger Bands
💡 Higher volatility often leads to larger price swings, while lower volatility usually indicates market consolidation.
🎯 Why Traders Use Indicators
📊 Traders use indicators to:
✅ Confirm market trends
🎯 Filter low-quality trading setups
🚀 Measure market momentum
📉 Identify changes in volatility
🧠 Improve consistency in decision-making
💡 Indicators provide additional evidence, but they should never be the only reason to enter a trade.
⚠️ Indicators are Lagging Tools
⏳ Most technical indicators are calculated using historical price data.
📊 As a result, they react to price movements rather than predict them.
💡 Professional traders analyse price first and use indicators only for confirmation.
🚫 Common Mistakes
Many beginners make these mistakes:
❌ Using too many indicators on one chart
❌ Taking trades based solely on indicator signals
❌ Ignoring price action
❌ Ignoring the overall market trend
❌ Believing indicators can predict future prices
💡 Adding more indicators does not necessarily improve trading decisions.
💡 Best Practices
📊 Use indicators to confirm what price is already showing.
A structured approach may include:
1️⃣ 📈 Identify the overall trend
2️⃣ 📍 Analyse support and resistance
3️⃣ 🕯️ Observe candlestick behaviour
4️⃣ 📊 Check trading volume
5️⃣ ✅ Use indicators for confirmation
6️⃣ 🛡️ Apply proper risk management before entering a trade
🎯 This process reduces emotional decision-making and improves trading discipline.
Technical indicators are valuable analytical tools that help traders understand trends, momentum, volume, and volatility. However, they are most effective when used alongside price action and market structure. Successful traders treat indicators as confirmation tools, not as standalone buy or sell signals.
⏳ Multi-Timeframe Analysis
- 📊 Markets move across multiple timeframes simultaneously.
📈 A stock may be in a long-term uptrend while experiencing a short-term pullback.
💡 Multi-Timeframe Analysis helps traders understand the bigger picture before making decisions on a smaller timeframe.
🔍 Instead of relying on a single chart, traders analyse multiple timeframes to improve the quality of their trading decisions.
📊 What is Multi-Timeframe Analysis?
📈 Multi-Timeframe Analysis is the process of analysing the same stock across different timeframes to gain a more complete understanding of its price behaviour.
Each timeframe provides a different perspective:
🏔️ Higher timeframes reveal the overall market direction.
🔍 Lower timeframes provide more detailed price movements.
💡 Combining both helps traders avoid taking trades against the broader trend.
🎯 Why Multi-Timeframe Analysis Matters
📊 Looking at only one timeframe can present an incomplete picture.
For example:
📅 Daily chart → Shows a strong uptrend.
⏰ 1-Hour chart → Shows a temporary pullback.
⚠️ Without the higher timeframe, a trader might incorrectly assume the trend has reversed.
💡 Multi-Timeframe Analysis helps traders distinguish between a temporary correction and a genuine trend change.
📈 The Top-Down Approach
👨💼 Professional traders often analyse charts from a higher timeframe to a lower timeframe.
1️⃣ Step 1 – Higher Timeframe
🏔️ Identify the overall market trend.
Ask:
❓ Is the stock in an uptrend, downtrend, or sideways market?
📍 Where are the major support and resistance zones?
2️⃣ Step 2 – Intermediate Timeframe
📊 Study the current market structure.
Look for:
🔄 Pullbacks
↔️ Consolidation
🚀 Breakouts
📈 Trend continuation
3️⃣ Step 3 – Lower Timeframe
🎯 Refine the trade execution.
Focus on:
🎯 Entry opportunities
✅ Confirmation
🛡️ Risk management
🛑 Stop-loss placement
💡 Each timeframe supports a different part of the trading process.
📊 Timeframes for Different Trading Styles
Different trading styles use different combinations of timeframes.
📈 Trading Style 🏔️ Higher Timeframe 🎯 Entry Timeframe
📅 Position Trading Weekly Daily
🌊 Swing Trading Daily 4-Hour or Daily
⚡ Short-Term Trading 4-Hour 1-Hour
💡 The exact combination may vary, but the principle remains the same—start with the bigger picture before focusing on execution.
💡 Benefits of Multi-Timeframe Analysis
Using multiple timeframes helps traders:
📈 Understand the broader market trend
🚫 Avoid trading against the dominant direction
🎯 Improve entry timing
🔍 Filter lower-quality setups
💪 Increase confidence in trade decisions
💡 It encourages a structured approach rather than impulsive decision-making.
⚠️ Common Mistakes
Many beginners make these mistakes:
❌ Analysing only one timeframe
❌ Ignoring the higher timeframe trend
❌ Switching between multiple timeframes without a plan
❌ Looking for confirmation until it supports a biased opinion
💡 Choose a few relevant timeframes and follow them consistently.
📝 Best Practices
A disciplined approach includes:
1️⃣ 🏔️ Begin with the higher timeframe
2️⃣ 📈 Identify the overall trend
3️⃣ 📍 Mark important support and resistance zones
4️⃣ 🔍 Move to a lower timeframe for confirmation
5️⃣ 📝 Plan the trade before entering
6️⃣ 🛡️ Follow your risk management rules
🎯 Consistency in the analysis process is often more valuable than constantly changing timeframes.
Multi-Timeframe Analysis helps traders see both the bigger picture and the finer details of market behaviour. By combining higher and lower timeframes, traders can align their decisions with the dominant trend, improve trade timing, and reduce the chances of acting on short-term market noise.
🛡️ Risk Management & Trading Psychology
- 📊 Successful trading is not determined by finding the perfect strategy.
💡 It is built on managing risk, controlling emotions, and consistently following a well-defined trading plan.
📉 Even the best Technical Analysis cannot eliminate losing trades.
🏆 What separates successful traders from unsuccessful ones is their ability to protect capital and make disciplined decisions, regardless of market outcomes.
💰 What is Risk Management?
🛡️ Risk Management is the process of limiting potential losses on every trade while protecting your trading capital over the long term.
Instead of asking,
💭 "How much can I make?"
Professional traders first ask,
❓ "How much am I willing to lose if this trade is wrong?"
💡 Protecting capital allows traders to remain in the market long enough to benefit from future opportunities.
📊 Why Risk Management Matters
⚠️ No trading strategy has a 100% success rate.
📉 Every trader experiences losing trades.
Without proper risk management:
💸 A few losses can significantly damage trading capital
😰 Emotional decisions become more frequent
📉 Recovery becomes increasingly difficult
💡 Small, controlled losses are a normal part of successful trading.
⚖️ Position Sizing
📏 Position sizing determines how much capital should be allocated to a single trade.
💡 Rather than investing the same amount in every opportunity, traders adjust their position size based on the amount of risk they are willing to take.
🎯 Proper position sizing helps maintain consistency regardless of market conditions.
🎯 Risk-Reward Ratio
⚖️ Every trade should have a clearly defined potential reward compared to the potential risk.
For example:
💰 Risk ₹1 to potentially earn ₹2
💰 Risk ₹1 to potentially earn ₹3
💡 A favourable Risk-Reward Ratio allows traders to remain profitable even if every trade is not successful.
🧠 Trading Psychology
💭 Markets constantly test emotions.
Common emotions include:
😨 Fear
💸 Greed
⏳ Impatience
😎 Overconfidence
⚠️ These emotions often lead to poor trading decisions.
💡 Successful traders focus on following their process rather than reacting emotionally to every price movement.
🎯 Emotional discipline is just as important as technical knowledge.
🚫 Common Psychological Mistakes
Many beginners experience these challenges:
😰 Fear of Missing Out (FOMO)
😡 Revenge trading after a loss
🔄 Overtrading without valid setups
📉 Moving the stop-loss to avoid accepting a loss
💸 Taking profits too early because of fear
💡 Recognising these behaviours is the first step toward improving discipline.
📓 The Importance of a Trading Journal
📝 A Trading Journal helps traders evaluate their decision-making process.
Recording every trade allows you to identify:
✅ What worked well
📈 What needs improvement
❌ Repeated mistakes
🧠 Emotional triggers
📊 Overall consistency
💡 Over time, a Trading Journal becomes one of the most valuable tools for continuous improvement.
💡 Building Good Trading Habits
Successful trading habits include:
📋 Following a written trading plan
⏳ Waiting patiently for quality setups
🛑 Respecting stop-losses
⚖️ Managing position size consistently
📖 Reviewing trades regularly
🎲 Thinking in probabilities instead of certainty
🎯 Consistency in behaviour often matters more than finding a new strategy.
Risk management protects your capital, while trading psychology protects your decision-making. Technical analysis may help identify opportunities, but long-term success depends on disciplined execution, controlled risk, and emotional consistency. The goal is not to avoid losses—it is to manage them intelligently while allowing profitable trades to grow.
🚫 The 6 Technical Analysis Mistakes That Hold Traders Back
Learning technical analysis is not just about knowing chart patterns or indicators. Many traders struggle because of avoidable mistakes in how they analyse the market and make decisions. Recognising these mistakes is the first step toward becoming a more disciplined trader.
🧰 Tools You Need to Learn Technical Analysis
- ✅ Charting Platform: Use clean daily and weekly charts to study price action, trends, support & resistance, and overall market structure. Keep charts simple and avoid unnecessary indicators.✅ Stock Screener: Use screeners to filter stocks based on technical criteria such as trend, volume, and liquidity. A screener helps you discover opportunities—it does not replace chart analysis.✅ Drawing Tools: Learn to use trendlines, horizontal levels, and price zones to identify important support, resistance, and market structure on your charts.✅ Trading Journal: Record every trade, including the setup, entry, exit, stop-loss, outcome, and key observations. Reviewing past trades helps improve consistency and decision-making.✅ Watchlist: Maintain a focused list of quality stocks that meet your technical criteria. Reviewing the same stocks regularly helps you understand their price behaviour over time.❌ Tip-Based Trading: News, tips, and social media opinions should never replace your own chart analysis. Every trading decision should be supported by objective technical evidence.❌ Indicator Overload: Using too many indicators often creates confusion and conflicting signals. Focus on price action first, then use indicators only for confirmation.
📋 The Technical Analyst's Checklist
- 01Market Trend First
Before analysing any stock, identify whether the overall market is in an uptrend, downtrend, or sideways phase. Individual stocks often perform better when they align with the broader market direction. - 02Understand the Market Structure
Study higher highs, higher lows, lower highs, and lower lows to determine who is currently in control—buyers or sellers. - 03Mark Key Support & Resistance
Identify important price zones where the market has previously reacted. Treat them as decision zones, not exact price levels. - 04Confirm with Volume
Check whether volume supports the price movement. Strong trends and breakouts are generally more reliable when accompanied by healthy trading volume. - 05Wait for Confirmation
Avoid entering trades based on assumptions. Let price action confirm the setup before making a trading decision. - 06Use Indicators as Confirmation
Indicators should support your analysis, not replace it. Always analyse price first and use indicators for additional confirmation. - 07Define Your Risk
Before entering any trade, determine your entry price, stop-loss, position size, and acceptable level of risk. Never trade without a plan. - 08Review & Improve
After every trade, review your charts and decisions. Continuous learning and disciplined execution are the foundation of long-term success.
❓ Frequently Asked Questions
How much money do I need to start swing trading in India?
You can start learning with any capital, but ₹50,000 is a practical starting point for applying proper risk management. With ₹50,000 capital and 0.5% risk per trade, your maximum planned risk is ₹250. The goal is not to make big money quickly—it is to learn position sizing, protect capital, and execute the process consistently.
Can I do swing trading with a full-time job?
Yes—swing and positional trading can fit around a full-time job. You can analyse the market, prepare your watchlist, and plan trades outside market hours, then review positions briefly each day. The focus is not constant screen watching; it is preparation, predefined risk, disciplined execution, and journaling.
How is swing trading taxed in India (2026)?
Tax treatment depends on how your trading activity is classified and your individual circumstances. Maintain proper records of trades, profits, losses, and charges. Since tax rules can change, consult a qualified CA for advice specific to your situation.
What's the best chart timeframe for swing trading?
The daily chart is the primary timeframe for swing trading decisions, while the weekly chart provides broader market and stock context. Avoid jumping between lower timeframes just to find confirmation for a trade.
Should I use stop-loss orders or mental stops?
Use a predefined stop-loss and exit plan. Mental stops often become emotional when price moves against you. Decide the invalidation level and maximum risk before entry, then execute according to the plan.
Swing trading vs options — which is better for beginners?
Start with equity swing trading. Beginners should first learn Market Health, stock selection, entry, risk management, trade management, and journaling. Build a rule-based foundation before exploring more complex instruments.
How many trades should I take per week?
Quality over quantity—always. There is no fixed number of trades you must take. Some weeks may offer multiple valid opportunities, while others may offer none. Your job is to follow the process, not manufacture trades. Patience is part of the system.
What are the best books for learning swing trading?
Study books that teach market cycles, price and volume behaviour, risk management, and trading psychology. But remember: collecting information is not the goal. Choose one structured process, execute it consistently, journal every trade, and learn from your own data.
📈 Trade With a Process, Not Predictions
Easyswingtrade.com helps you understand market context, build focused watchlists, manage risk, and journal every decision — so your trading follows a repeatable process, not emotion.