
Why Trading Is Mathematics — The Complete Guide to Probability, Risk & Consistency
💡 What You'll Learn
- Trading is built around probability, not prediction — making structured decisions based on market context, predefined risk, and repeatable rules instead of trying to predict what happens next.
- One trade proves nothing. The biggest mistake traders make is judging a system after a few wins or losses without understanding probability, sample size, and long-term expectancy.
- Risk–reward changes the entire equation. You do not need to win every trade to grow; what matters is how much you make when right versus how much you lose when wrong.
- Position sizing is where mathematics protects capital. A good setup with oversized risk can damage an account, while controlled exposure keeps one trade from deciding your future.
- Consistency comes from repetition, not excitement. Follow the same process across market health, stage, screening, watchlist, entry, management, and journaling.
- Stress-free trading begins when outcomes stop controlling decisions — accept uncertainty, manage risk, document results, study your numbers, and improve the process one step at a time.
If you have ever looked at a trading chart and thought — “I understand the setup, but how can anyone make money when every trade can either win or lose?” — then mathematics is the missing piece. Trading is not about knowing what the next stock will do. It is about building a process where a series of uncertain outcomes can still produce a measurable result over time.
Trading occupies the space between probability and risk. You are not trying to be right on every trade. You are controlling how much you lose when wrong, how much you can make when right, and how consistently you repeat the same process. One trade is random. A large sample of disciplined trades becomes data. It demands patience, not prediction. Process, not excitement. And for traders who want consistency without depending on tips, news, or emotions — mathematics is what turns trading from guesswork into a structured decision-making business.
📈 What Trading Mathematics Actually Is (And Why One Trade Means Nothing)
Trading mathematics is the practice of making decisions using probability, risk, reward, and repetition instead of trying to predict every market move. A single trade can end in profit or loss regardless of how good the decision was. The real edge appears over a large sample of consistently executed trades. No prediction pressure. No need to be right every time. No emotional panic after one loss.
What Trading Mathematics Is Not.
- Not “predicting the market.” You do not need to know what happens next. Every trade begins with uncertainty. Mathematics helps you define risk, potential reward, and the action you will take for different outcomes.
- Not risk-free. Even the best trading system will have losing trades and losing streaks. Position sizing and predefined risk are your protection. The objective is not to avoid every loss; it is to keep losses mathematically manageable.
- Not “win every trade.” A profitable trader can be wrong many times. What matters is the combination of win rate, average profit, average loss, and consistent execution. Accuracy alone ≠ profitability.
- Not a shortcut to guaranteed returns- Mathematics gives structure to uncertainty; it does not remove uncertainty. Trading is a repeated decision-making process where discipline, risk control, and a sufficient sample size allow an edge to reveal itself.
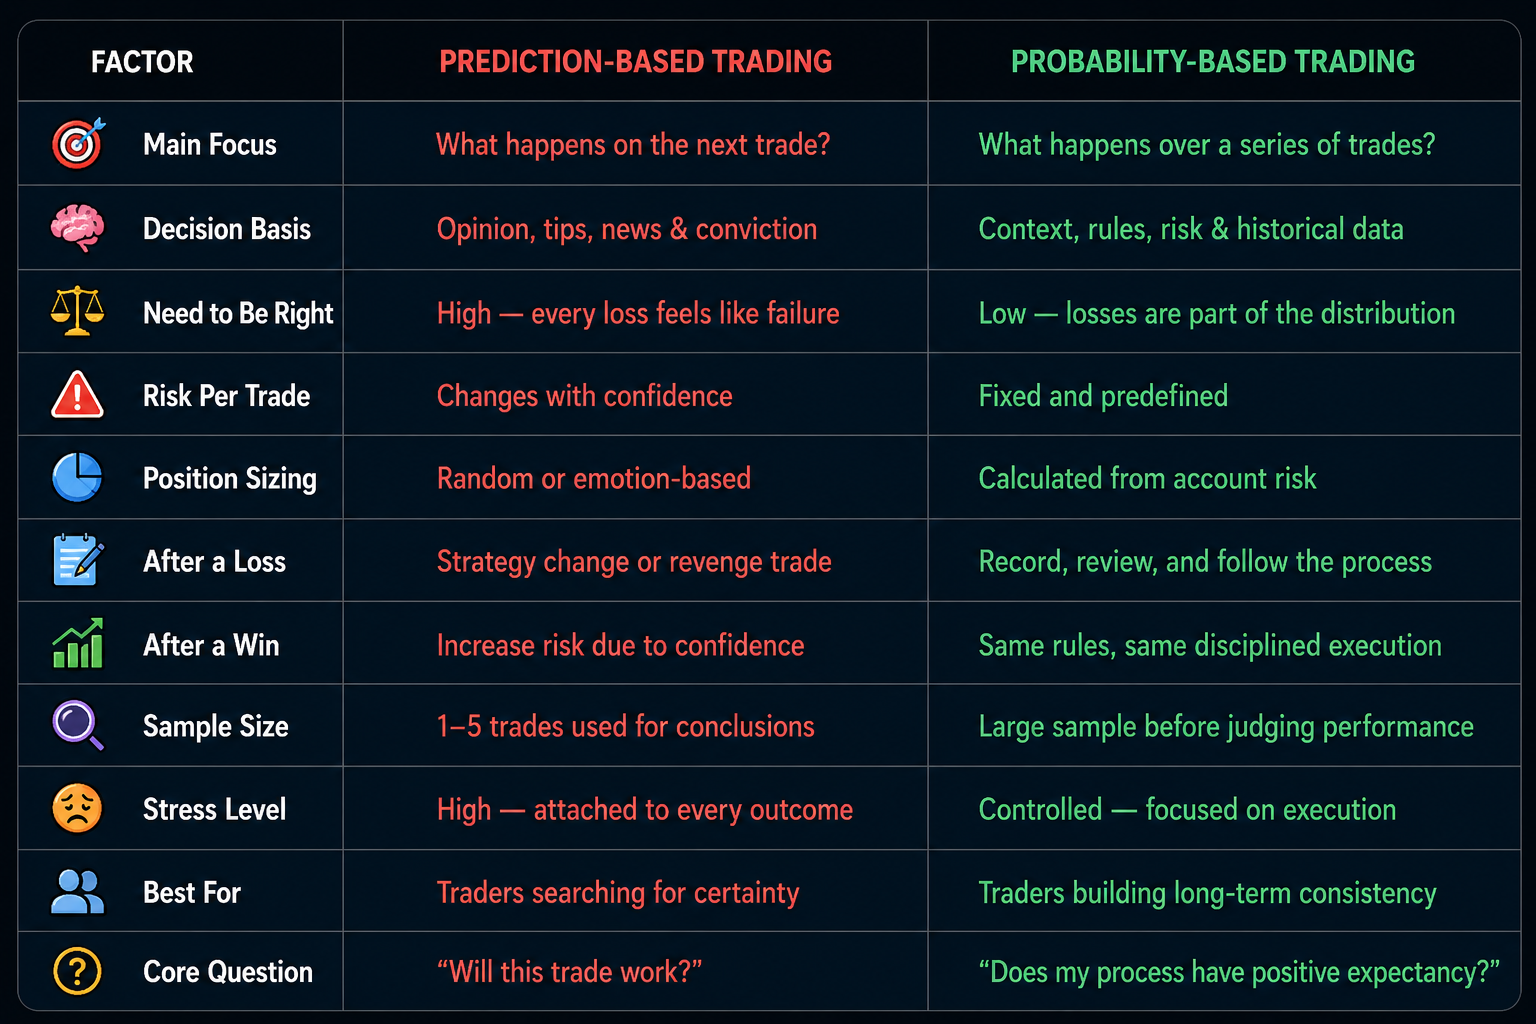
⚡ Prediction vs Probability — The Honest Comparison
Most traders enter the market trying to answer one question: “What will this stock do next?” Mathematical traders ask a different question: “If I repeat this decision 50 times, what does the data say?” Neither approach can remove uncertainty—but only one creates a process that can be measured, reviewed, and improved.
🌊 Step Zero — Understand the Market Context (Before Calculating Any Trade)
This is the step most traders ignore—and it changes every mathematical assumption that follows. Before calculating win rate, risk–reward, or position size, you must first ask: Is the current market environment supporting my trading strategy, weakening it, or offering limited opportunity?
Supportive Market — Your Edge Is Working
Your setups are showing successful breakouts, strong follow-through, and controlled pullbacks. Watchlist stocks are behaving constructively. This is where your historical trading edge has a better chance to express itself—take valid setups normally, but never increase risk beyond your predefined rules.
Weak Market — Protect the Downside
Breakouts are failing, stocks are losing key levels, and your watchlist is giving negative feedback. Even a historically profitable setup can experience a lower win rate in an unfavourable environment. Reduce exposure, become highly selective, or stay in cash. No trade is also a mathematical decision.
Mixed Market — Reduce Frequency, Raise Selectivity
Some sectors and stocks are working while others are failing. Opportunity exists, but it is selective rather than broad. Take fewer trades, focus on relative strength and the strongest structures, and allow actual trade feedback to determine whether exposure should expand or contract.
The Weekly Mathematics Ritual — 10 Minutes That Define Your Risk
Every weekend, review your Market Health, watchlist behaviour, and recent trade data. Ask three questions: (1) Are valid setups producing follow-through? (2) Are breakouts succeeding or failing? (3) Is my recent performance aligned with the historical behaviour of my system? Write the answers in your journal. This 10-minute review helps you adjust exposure and selectivity—not abandon the strategy emotionally.
🔢 The 5-Step Mathematical Trading Framework
Trading mathematics is not just about calculating risk–reward. A profitable equation begins before entry and continues after exit. One good trade proves nothing, and one bad trade proves nothing. Here’s the simple framework for turning trading decisions into measurable data. This follows the broader SMC logic of moving from market context toward selection, execution, risk management, and review.
Define Risk First — Decide the Maximum Loss
Before thinking about profit, define exactly how much capital you are willing to risk. For example, with ₹50,000 capital and 0.5% risk per trade, maximum risk is ₹250. This number should be decided before entry—not after the stock starts falling.
Calculate Position Size — Quantity Must Match Risk
Position size should come from account risk and stop-loss distance, not confidence. If maximum risk is ₹250 and entry-to-stop distance is ₹5 per share, the mathematical position size is 50 shares. Same setup, different stop distance = different quantity. SMC’s institutional-trading material also frames quantity through predefined account risk and entry/stop-loss inputs.
Define the Payoff — Know What You Risk to Make
Every trade has two sides of the equation: potential loss and potential gain. If you risk ₹250 to potentially make ₹500, the planned reward-to-risk is 2:1. But remember—the ratio alone is not an edge. It must work together with your actual win rate.
Record Every Outcome — Convert Trades Into Data
Do not remember trades emotionally. Record them. Track the setup, risk, outcome in R, rule adherence, and mistakes. After a meaningful sample, patterns begin to appear: average win, average loss, win rate, losing streaks, and whether execution matches the original plan.
Calculate Expectancy — Judge the Process, Not One Trade
The final question is not “Did my last trade make money?” It is: “Does this process make mathematical sense over a large sample?” Expectancy combines win rate with average win and average loss. The goal is not perfection—it is a repeatable process where losses remain controlled and winners are allowed to contribute meaningfully. The SMC material similarly emphasizes four possible trade outcomes and protecting capital by controlling the loss side.
🎯 The 5 Mathematical Principles Every Trader Must Understand
Trading mathematics is not about filling charts with formulas. These five principles work together as one system. Study them across a meaningful sample of your own trades. A trader who deeply understands risk, reward, expectancy, position sizing, and sample size has a stronger foundation than someone who keeps jumping between strategies.
Risk Per Trade — Decide the Loss Before the Profit
The idea: Every trade begins with one mathematical question: How much am I willing to lose if this trade fails? Your risk should come from account size and predefined rules—not confidence, excitement, or how strongly you believe in the stock.
- Capital: Start with your total trading capital.
- Risk %: Define a fixed maximum risk percentage per trade.
- Risk Amount: Capital × Risk % = maximum acceptable loss.
- Currency Pressure: Monitor whether currency behavior is supportive or creating pressure on domestic risk assets.
- Example: ₹50,000 capital × 0.5% risk = ₹250 maximum risk.
- Rule: Never increase risk simply because the previous trade was profitable.
- Purpose: One trade should never have the power to damage your trading journey.
Risk–Reward — You Don’t Need to Win Every Time
The idea: Profitability is not decided by win rate alone. A trader can lose more trades than they win and still remain profitable if average winners are meaningfully larger than average losses.
- Risk: Define 1R as the amount you are prepared to lose.
- Reward: Measure potential upside in multiples of R.
- Example: Risk ₹250 and make ₹500 on a winner = +2R.
- Break-even logic: Higher average reward can reduce the win rate required to break even, before costs.
- Caution: A beautiful risk–reward ratio on paper means nothing if it cannot be executed consistently.
- Focus: Judge the relationship between average win and average loss—not one lucky trade.
Position Sizing — Quantity Must Come From Risk
The idea: Two traders can buy the same stock at the same price and still experience completely different account outcomes. The difference is often not stock selection—it is position size.
- Step 1: Calculate maximum account risk for the trade.
- Step 2: Calculate the difference between entry and stop-loss.
- Formula: Risk amount ÷ risk per share = position quantity.
- Example: ₹250 maximum risk ÷ ₹5 stop distance = 50 shares.
- Rule: Wider stop-loss means smaller quantity; tighter stop-loss means larger quantity within the same predefined risk.
- Purpose: You decide how much the market can take from you before entering the trade. The uploaded SMC material similarly connects position sizing to account risk, entry price, and stop-loss price.
Expectancy — Find Out Whether Your Process Makes Sense
The idea: A strategy should not be judged by its last trade. Expectancy combines your probability of winning with the size of your average wins and losses to evaluate performance across repeated execution.
- Track: Win rate, average win, average loss, and total trades.
- Think in R: Compare outcomes using risk units instead of only rupees.
- Example: 40% wins at +2R and 60% losses at −1R gives positive expectancy of +0.2R per trade, before costs and slippage.
- Review: Calculate results only after collecting a meaningful sample.
- Mistake: Changing the strategy after three losses destroys the usefulness of the data.
- Strength: Expectancy shifts attention from “Did I win today?” to “Am I executing a positive process?”
Sample Size — Let the Edge Reveal Itself
The idea: One trade can be luck. Five trades can still be noise. Mathematics becomes useful when the same rules are executed repeatedly and honestly enough to create comparable data.
- Consistency: Take only trades that fit your defined process.
- Documentation: Journal entry, risk, outcome, mistakes, and rule adherence.
- Review: Look for patterns across groups of trades—not isolated outcomes.
- Response: Adjust only when evidence is meaningful, not because of fear after a losing streak.
- Why it matters: A good process can have losing sequences; a poor process can temporarily produce winning sequences.
- Core lesson: Your job is not to control the next outcome. Your job is to execute consistently enough for the mathematics to become visible.
🛡️ Position Sizing & Risk Management — The Mathematics of Survival
Risk management is where trading mathematics becomes real. You cannot control whether the next trade becomes a winner or a loser—but you can control how much capital is exposed when you are wrong. The principle is simple: keep losses small enough to survive, and give profitable trades enough room to contribute.
The 0.5% Risk Rule
Risk only 0.5% of your total trading capital on a single trade. This keeps one loss emotionally and financially manageable, and allows you to continue following the same process even through a normal losing streak.
🔍 How to Calculate Position Size — Step by Step
Identify Entry & Stop-Loss
Suppose you plan to buy a stock at ₹200 and your predefined stop-loss is at ₹195. The difference between entry and stop-loss is ₹5.
Calculate Maximum Quantity
Your capital is ₹50,000 and predefined risk is 0.5%, so:
Evaluate the Reward Side
Suppose your trade plan identifies a potential exit area at ₹210.
🧮 The Weekly Routine of a Mathematical Trader
Trading mathematics becomes useful only when your decisions are recorded consistently. A professional trader follows a weekly rhythm of preparation, execution, and review. The difference is simple: one trader collects data; the other collects emotional memories.
- 📋 Sunday Evening (30 min): Review Market Health, recent watchlist behaviour, and current exposure. Prepare the week with predefined risk rules and a focused watchlist.
- 📊 Monday–Friday (15 min): Review watchlist behaviour and open positions. Take only rule-based opportunities and calculate position size before placing any trade.
- 📉Before Every Entry (5 min): Calculate account risk, risk per share, quantity, and planned reward-to-risk. If the numbers do not fit the plan, skip the trade.
- 🧘Friday Evening (20 min): Update the journal. Record wins, losses, R-multiples, mistakes, and rule adherence. Review the process—not only weekly P&L.
- 🖊 Saturday: No unnecessary chart hopping or strategy hunting. A clear mind protects traders from changing a process based on short-term outcomes.
- 📱 Monday: Sees a stock moving fast. Buys immediately because the chart “looks strong.” Position size is based on available cash, not predefined risk.
- 📉 Tuesday: Stock hits the stop-loss area. Moves the stop lower because “it may recover.” The planned small loss starts becoming larger.
- 😰 Wednesday: Price falls further. Adds more quantity to average down. Original risk calculation no longer exists.
- 📺 Thursday: Searches videos and social media for reassurance. Finds a bullish opinion and decides to “hold for the long term.”
- 😤 Friday: Finally exits after the loss becomes emotionally unbearable. Blames the market, the stock, or the strategy—and starts searching for a new setup.
- 🤷 Next Monday: Repeats the same behaviour with a different stock because no journal, review process, or measurable data exists.
🛑 The 6 Mathematical Mistakes That Kill Traders
🧰 Tools You Need to Trade the Mathematics
- ✅ Charting Platform: Use clean daily and weekly charts to study price behaviour, market context, and trade structure. Keep charts simple—the goal is decision clarity, not indicator overload.
- ✅ Stock Screener: Use screening tools to reduce thousands of stocks into a manageable research list. A screener finds candidates; it does not replace chart study or decision-making.
- ✅ Position Size Calculator: Before every trade, calculate capital risk, entry-to-stop distance, and quantity. With ₹50,000 capital and 0.5% risk, your maximum planned risk is ₹250.
- ✅ Trade Journal: Record date, stock, setup, entry, stop-loss, quantity, initial risk, exit, R-multiple, and rule adherence. Your journal is where trading stops being memory and becomes measurable data.
- ✅ Performance Dashboard: Track win rate, average winner, average loser, expectancy, maximum losing streak, and rule violations. Review these numbers over a meaningful sample—not after every two or three trades.
- ❌ Tip-Based Decisions: A tip gives you an entry idea but rarely gives you a complete risk equation. If you cannot independently define the risk, quantity, and exit response, the trade is incomplete.
- ❌ Strategy Hopping: Constantly changing systems makes meaningful measurement impossible. Follow one defined process, collect enough comparable trades, review the data, and improve gradually—not emotionally.
📈 The Mathematical Trader’s Checklist
- 01Market Context First: Before taking any trade, check whether the market environment supports your process. Mathematics works inside context—not in isolation.
- 02Define Risk Before Entry: Decide the maximum account risk before buying. With ₹50,000 capital and 0.5% risk, the maximum planned loss is ₹250.
- 03Calculate Position Size: Quantity = Maximum Risk ÷ Risk Per Share. Never choose quantity based on confidence, excitement, or available margin.
- 04Know the Payoff: Compare potential reward with predefined risk before entering. A high win rate cannot rescue a process where losses are consistently much larger than winners.
- 05Accept the Outcome: Once risk is controlled, accept that the individual trade can still lose. Your responsibility is correct execution—not forcing a profitable outcome.
- 06Think in Sample Size: Never judge your system after three wins or five losses. Execute the same rules across a meaningful set of comparable trades before drawing conclusions.
- 07Journal Every Trade: Record entry, stop, quantity, initial risk, exit, R-multiple, mistakes, and rule adherence. Review patterns in decisions, not just P&L.
- 08Review, Don’t React: At the end of each week, study your numbers calmly. Improve one small part of the process at a time. Response > prediction. Process > excitement.
❓ Frequently Asked Questions
How much money do I need to start swing trading in India?
You can start learning with any capital, but ₹50,000 is a practical starting point for applying proper risk management. With ₹50,000 capital and 0.5% risk per trade, your maximum planned risk is ₹250. The goal is not to make big money quickly—it is to learn position sizing, protect capital, and execute the process consistently.
Can I do swing trading with a full-time job?
Yes—swing and positional trading can fit around a full-time job. You can analyse the market, prepare your watchlist, and plan trades outside market hours, then review positions briefly each day. The focus is not constant screen watching; it is preparation, predefined risk, disciplined execution, and journaling.
How is swing trading taxed in India (2026)?
Tax treatment depends on how your trading activity is classified and your individual circumstances. Maintain proper records of trades, profits, losses, and charges. Since tax rules can change, consult a qualified CA for advice specific to your situation.
What's the best chart timeframe for swing trading?
The daily chart is the primary timeframe for swing trading decisions, while the weekly chart provides broader market and stock context. Avoid jumping between lower timeframes just to find confirmation for a trade.
Should I use stop-loss orders or mental stops?
Use a predefined stop-loss and exit plan. Mental stops often become emotional when price moves against you. Decide the invalidation level and maximum risk before entry, then execute according to the plan.
Swing trading vs options — which is better for beginners?
Start with equity swing trading. Beginners should first learn Market Health, stock selection, entry, risk management, trade management, and journaling. Build a rule-based foundation before exploring more complex instruments.
How many trades should I take per week?
Quality over quantity—always. There is no fixed number of trades you must take. Some weeks may offer multiple valid opportunities, while others may offer none. Your job is to follow the process, not manufacture trades. Patience is part of the system.
What are the best books for learning swing trading?
Study books that teach market cycles, price and volume behaviour, risk management, and trading psychology. But remember: collecting information is not the goal. Choose one structured process, execute it consistently, journal every trade, and learn from your own data.
📈 Trade With a Process, Not Predictions
Easyswingtrade.com helps you understand market context, build focused watchlists, manage risk, and journal every decision — so your trading follows a repeatable process, not emotion.